Most nonprofits collect data. Few actually use it to make decisions, communicate impact to funders, or keep board members informed without someone spending a full day pulling numbers into a spreadsheet.
Salesforce's own research backs this up. According to the fifth edition of the Nonprofit Trends Report (a global survey of more than 1,600 nonprofit managers and executives across seven countries) only 12% of nonprofits qualify as digitally mature. That same report found that digitally mature organizations are 4x more likely to achieve their mission goals and 2x more likely to improve operational efficiency. They also report 3.5x higher employee motivation.
The gap between collecting data and acting on it is where most Salesforce nonprofit implementations either pay off or stall. And reporting, specifically, automated reporting, is the lever that closes that gap.
This guide covers how nonprofits actually use Salesforce ecosystem (Nonprofit Cloud, NPSP, and the Program Management Module), what to track and for whom, and how to automate the reports your board, funders, and program teams need, using subscriptions, reporting snapshots, and Flow. It also includes ready-to-use report pack templates you can adapt to your org today.
What "Salesforce for Nonprofits" Means Today
If you search "Salesforce for nonprofits," you'll run into three product names that overlap in confusing ways: Nonprofit Cloud, NPSP, and PMM. Here's how they actually relate to each other, and which one matters for your reporting setup.
Nonprofit Cloud
Nonprofit Cloud is Salesforce's purpose-built industry solution for nonprofits. Think of it as the umbrella product. It includes a nonprofit-specific data model (with objects for fundraising, program management, case management, and outcome tracking), plus features like Accounting Subledger, Nonprofit Copilot actions, and, as of 2025, Agentforce integrations for donor engagement and program operations. However, the availability of these features depends on the specific edition and licensing tier — not all capabilities are included in every package.
For 2026, pricing for additional licenses beyond the donated set starts at $60/user/month (Enterprise Edition) and $100/user/month (Unlimited Edition), billed annually. Grantmaking editions start at $175/user/month (Salesforce Nonprofit Cloud Pricing Page).
One thing to understand: Nonprofit Cloud is where Salesforce is investing its development resources going forward. If you're starting fresh, Nonprofit Cloud is usually the strategic default to evaluate first, especially if you need fundraising, program, case, and outcome management in one roadmap.
Nonprofit Success Pack (NPSP)
NPSP is a set of managed packages that sit on top of standard Salesforce (Sales Cloud). It introduced the nonprofit data model that thousands of organizations have used since the early 2010s - household accounts, recurring donations, affiliations, relationships, and donation management through the Opportunity object.
NPSP remains free, open-source, and actively supported, still installable through the Salesforce.org / MetaDeploy ecosystem. However, Salesforce's strategic direction is clearly toward Nonprofit Cloud. For organizations already running NPSP, there's no forced migration — Salesforce has published bridging components (Nonprofit Cloud for NPSP) that allow NPSP orgs to start adopting Nonprofit Cloud features incrementally.
Where NPSP matters for reporting: its data model defines how donations, campaigns, contacts, and households are structured. Every report you build in an NPSP org depends on understanding these objects and their relationships. The official NPSP Reports Workbook (available on Salesforce's NPSP documentation hub) provides pre-built report templates mapped to this data model, a strong starting point before you customize anything.
Program Management Module (PMM)
PMM is a separate managed package, also free and open-source (the code is on GitHub), that adds program delivery and outcome tracking to Salesforce.PMM’s core reporting structure centers on objects such as Programs, Program Engagements, Program Cohorts, Services, and Service Deliveries.
If your nonprofit tracks things like "how many participants completed a workforce readiness program" or "how many meals were delivered in Q3," PMM is the framework that stores and relates that data. Without it (or a custom equivalent), program reporting in Salesforce tends to devolve into spreadsheets or loosely connected custom objects with no standard structure.
PMM works alongside both NPSP and Nonprofit Cloud. For reporting purposes, it gives you the objects and relationships you need to build program impact dashboards - services delivered by program, participant outcomes over time, and cohort completion rates.
Quick orientation for the rest of this guide:
- If you're on Nonprofit Cloud: you already have the nonprofit data model, fundraising objects, and program/case management objects built in. Reporting builds directly on these.
- If you're on NPSP + PMM: your fundraising data lives in NPSP objects, your program data lives in PMM objects, and your reports will pull from both.
- If you're on NPSP only: you can still build strong fundraising and donor reports, but you'll need PMM (or custom objects) for program outcome reporting.
What Nonprofits Typically Track in Salesforce
Before you touch a single report or dashboard, you need to know what data your Salesforce org should hold. This sounds obvious, but most nonprofit implementations go sideways not because the platform can't do something, but because nobody agreed on what to track, where to store it, or who's responsible for keeping it clean.
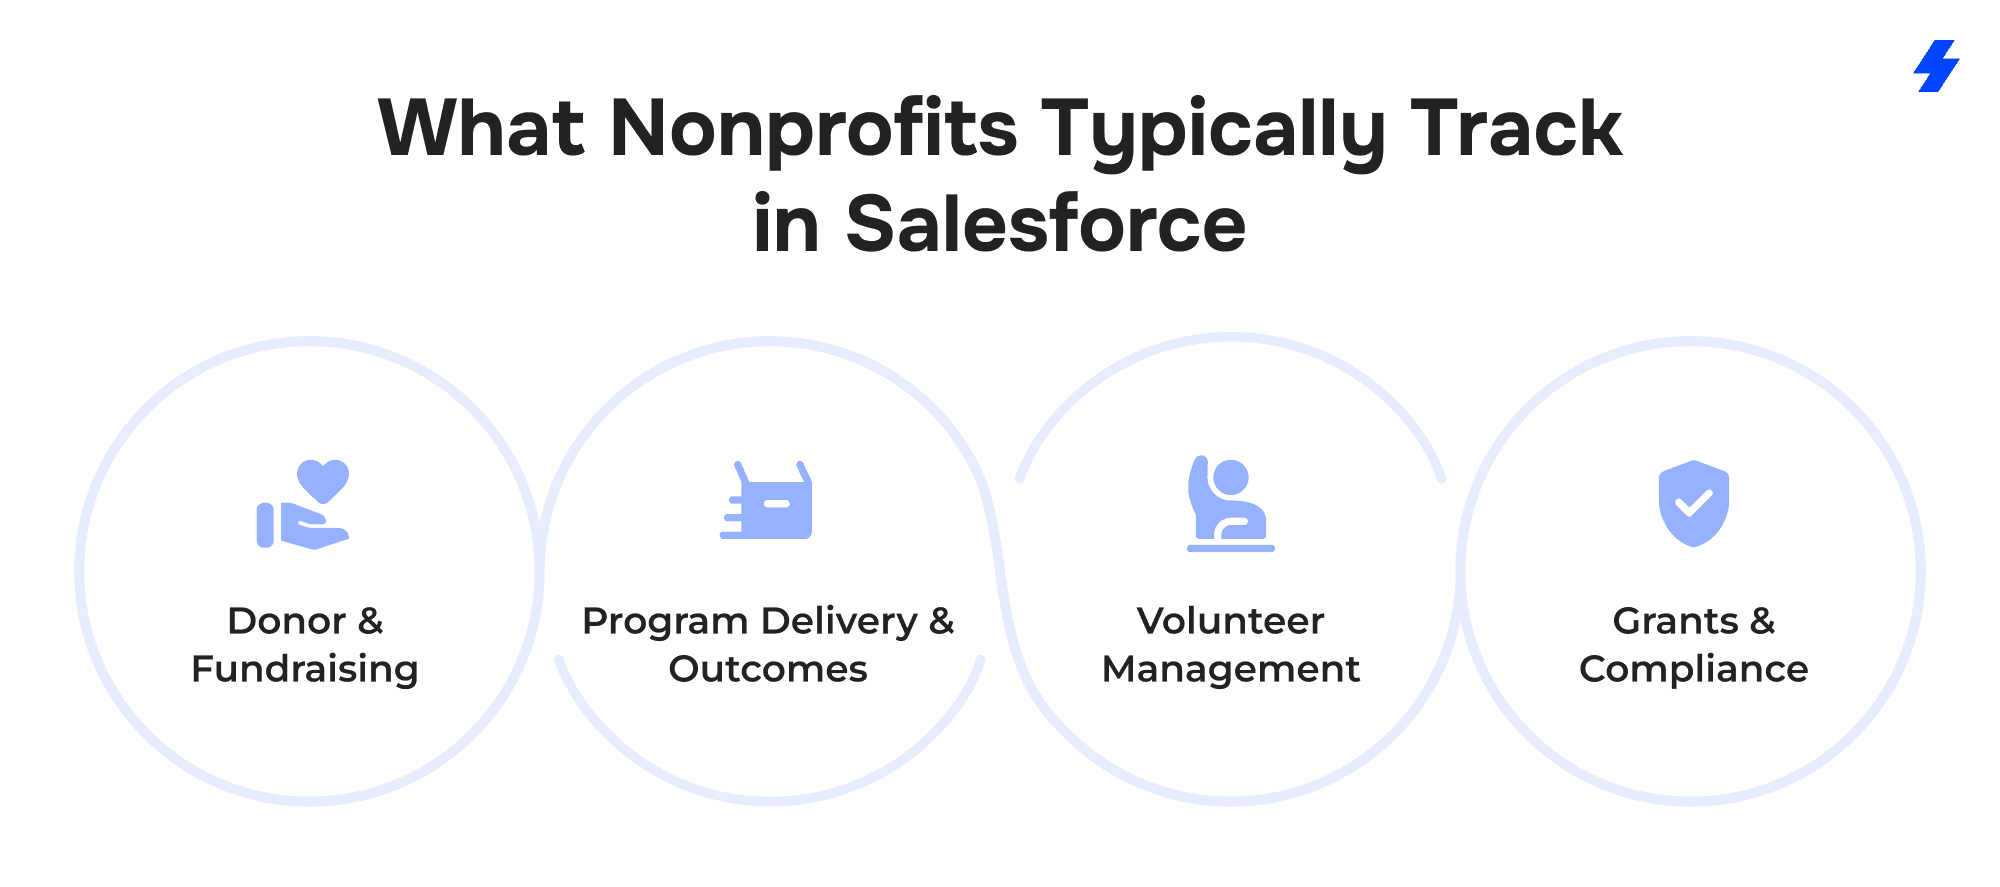
Here are the four core data domains most nonprofits manage in Salesforce, and the objects that typically store them.
Donor and Fundraising Tracking
Salesforce (whether through Nonprofit Cloud or NPSP) tracks:
- Individual and organizational donors — stored as Contacts and Accounts. NPSP uses Household Accounts to group family members; Nonprofit Cloud uses a person account model or the nonprofit data model's built-in structures.
- Donations — stored as Opportunities. Each gift is an Opportunity record with an amount, date, stage (pledged, received, refunded), and campaign association.
- Recurring giving — NPSP has a dedicated Recurring Donations object that generates scheduled Opportunity records automatically. Nonprofit Cloud handles this through its own recurring gift framework.
- Campaigns — used to track fundraising appeals, events, email blasts, and peer-to-peer efforts. Campaign Members link Contacts to specific campaigns so you can measure response rates and ROI.
- Major gifts pipeline — managed through Opportunity stages and close dates, similar to how a sales team tracks deals.
Example: A mid-sized food bank uses Campaigns to track its annual gala, year-end email appeal, and monthly sustainer acquisition program separately. Each Campaign has associated Opportunities, so the development director can pull a single report showing revenue by campaign, average gift size, and donor retention from one year to the next.
Program Delivery and Outcomes
Without a structured program data model, most nonprofits end up tracking participants in spreadsheets or cramming program data into Contact records where it doesn't belong.
With PMM, you track:
- Programs — the high-level initiative (e.g., "Youth Workforce Readiness," "Emergency Housing Assistance").
- Program Engagements — the link between a Contact and a Program. This is where you record enrollment date, status (active, completed, withdrawn), and engagement-level notes.
- Services and Service Deliveries — the specific activities delivered (e.g., "Resume Workshop," "Meal Delivery") and the individual delivery records (who received what, when, how many units).
- Outcomes — measurable results tied to program participation (e.g., "Obtained employment within 90 days," "Maintained stable housing for 6 months").
Example: A workforce development nonprofit enrolls participants in a 12-week training program. Each participant has a Program Engagement record. Every workshop they attend is logged as a Service Delivery.
At program completion, outcomes (job placement, certification earned) are recorded against the engagement. When a funder asks "how many participants found employment within 90 days of completing your program?" - the answer is a report, not a two-week scavenger hunt.
Volunteer Management
Salesforce doesn't have a native volunteer module out of the box, but several AppExchange packages (Volunteers for Salesforce being the most widely used free option) add:
- Volunteer hours — logged against Contacts, linked to specific shifts or programs.
- Shifts and jobs — scheduled volunteer opportunities tied to Campaigns or Programs.
- Skills and availability — stored as custom fields or related records on the Contact, used for matching volunteers to needs.
Some organizations build lightweight volunteer tracking with custom objects instead of a package. Either way, the goal is the same: get volunteer hours, participation rates, and program-level contributions into reportable records.
Grants and Compliance Tracking
For nonprofits that receive government or foundation grants, Salesforce can track:
- Grant records — often stored as Opportunities (with a Grant record type) or through Nonprofit Cloud's Grantmaking objects.
- Deliverables and milestones — custom objects or checklist items linked to the grant, each with a due date and completion status.
- Budget vs. actuals — tracked either through a related list of budget line items or integrated with accounting software.
- Reporting deadlines — the dates your funder expects narrative and financial reports, tracked as Tasks or custom milestone records.
Example: A community health nonprofit manages three federal grants simultaneously, each with different reporting cycles (monthly, quarterly, annual). Each grant has milestone records with due dates. A scheduled Flow sends reminders to the program manager 14 days before each reporting deadline. When it's time to submit, the required data, participants served, services delivered, spend against budget, already lives in Salesforce instead of being reconstructed from email threads.
Define Your Reporting Framework Before You Build Anything
Here's the mistake most nonprofits make with Salesforce reporting: they jump straight into the report builder, create a dozen reports that answer last week's question, and end up with a cluttered Reports folder that nobody trusts six months later.
The Nonprofit Reporting Blueprint
Below is a starter template. Copy it, adapt it to your org, and fill in the specifics before you configure anything in Salesforce.
Stakeholder → What They Need → Key Metrics → Data Source → Owner
- Board of Directors → High-level organizational health, quarterly. Key metrics: total revenue vs. budget, donor retention rate, beneficiaries served, program outcome highlights, cash reserves. Data source: Opportunities, PMM objects, custom budget objects. Owner: Executive Director or Development Director.
- Funders / Grantors → Grant-specific performance, per reporting cycle. Key metrics: deliverables completed vs. planned, participants enrolled and served, spend vs. budget, outcome metrics specified in the grant agreement. Data source: Grant Opportunity, PMM Service Deliveries, budget line items. Owner: Grants Manager.
- Development / Fundraising Team → Pipeline and donor health, weekly or biweekly. Key metrics: gifts received this month/quarter/year, donor acquisition and retention rates, recurring giving trends, lapsed donor count, campaign ROI, major gifts pipeline. Data source: Opportunities, Campaigns, Recurring Donations. Owner: Development Director.
- Program Team → Service delivery and participant progress, monthly. Key metrics: participants enrolled by program, services delivered (count and type), cohort completion rates, outcome achievement rates. Data source: PMM Programs, Engagements, Service Deliveries, Outcomes. Owner: Program Manager.
- Finance / Operations → Revenue reconciliation and cost tracking, monthly. Key metrics: revenue by source, pledge receivables, grant burn rate, cost per participant/outcome. Data source: Opportunities, budget objects, accounting integration. Owner: Finance Manager.
- Volunteer Coordinator → Volunteer engagement, monthly. Key metrics: total volunteer hours, hours by program, shift fill rate, active vs. inactive volunteers. Data source: Volunteer Hours object, Campaigns/Shifts. Owner: Volunteer Coordinator.
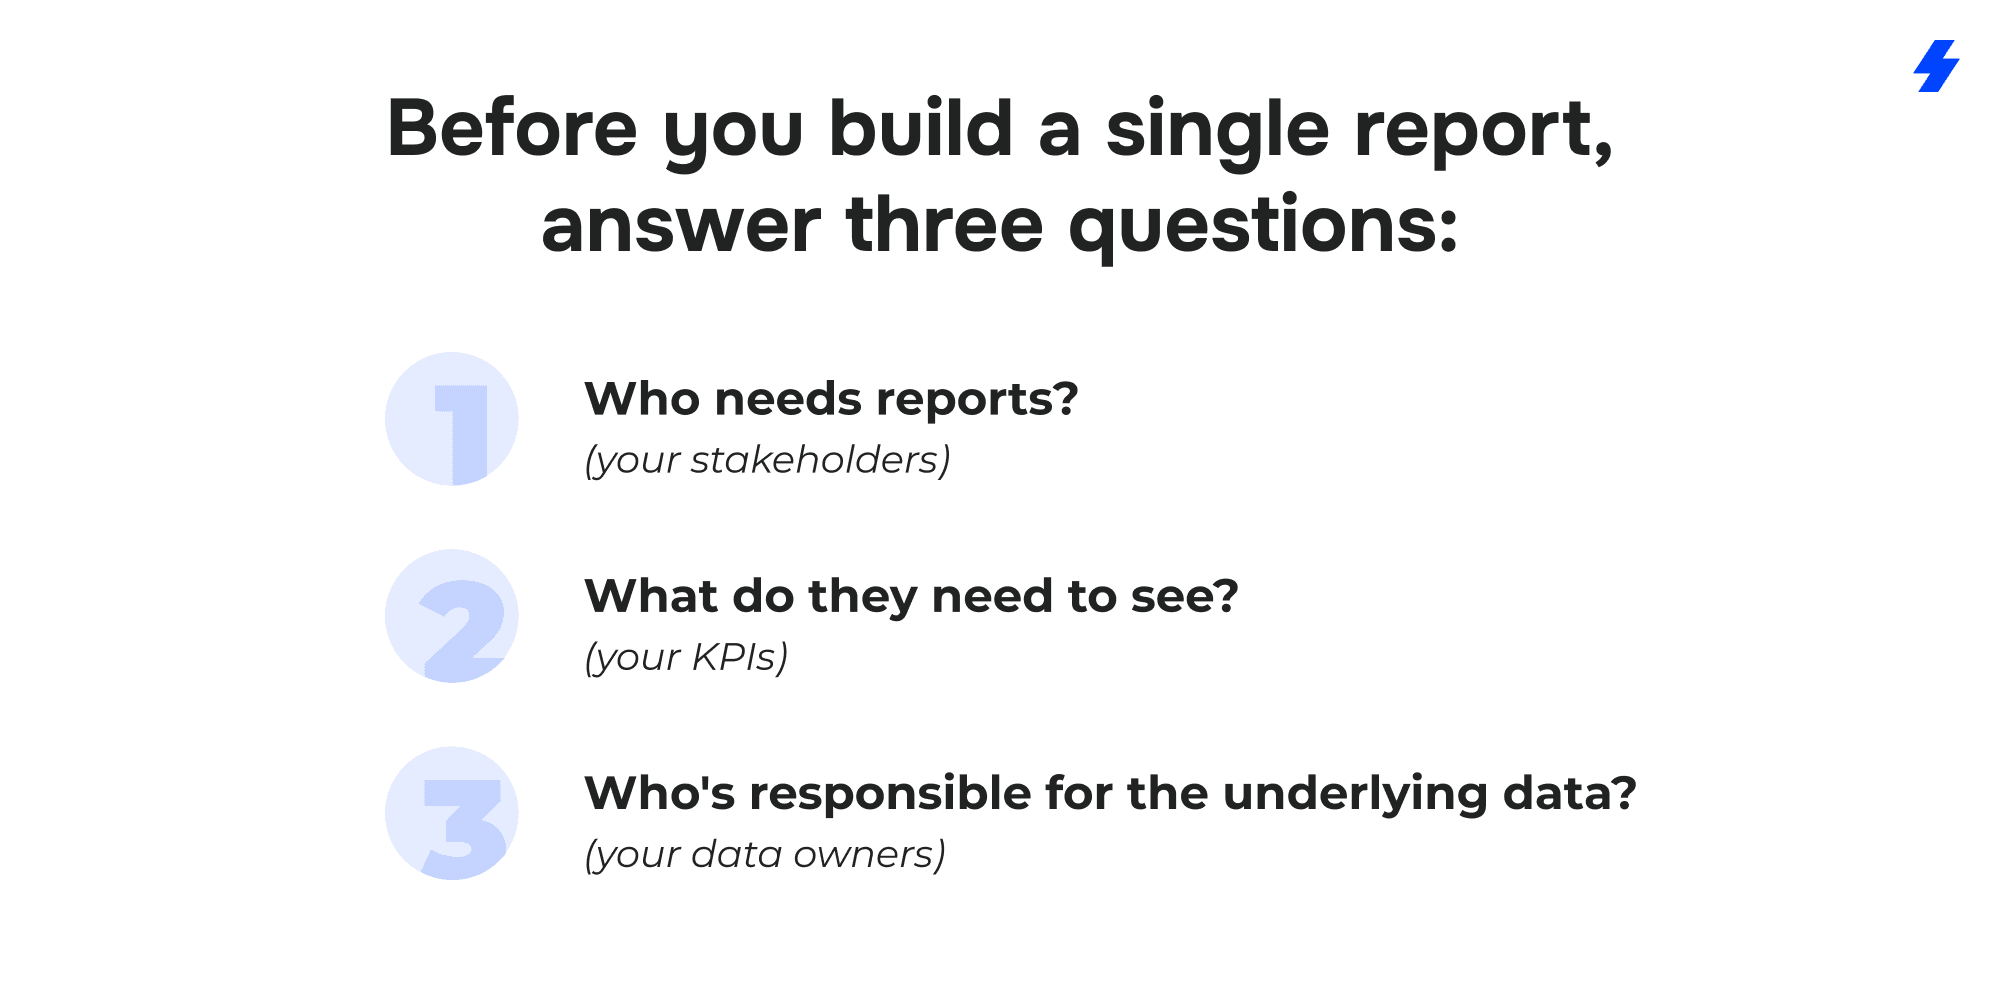
Build a KPI Library (Before You Build Reports)
Once you've mapped stakeholders to metrics, define each KPI precisely. This prevents the situation where two people pull the same metric and get different numbers because they used different filters.
For each KPI, document:
- Name — e.g., "Donor Retention Rate"
- Definition — "Percentage of donors who gave in the previous fiscal year and also gave in the current fiscal year"
- Salesforce filter logic — "Opportunities with Stage = Closed Won, grouped by Contact, comparing FY25 vs. FY24"
- Frequency — monthly, quarterly, annual
- Owner — who's responsible for validating this number
Even five or six well-defined KPIs will save your team hours of "wait, how are we calculating that?" conversations.
Set Data Governance Rules Early
Your reports are only as reliable as the data behind them. Three rules that prevent most data quality issues in nonprofit Salesforce orgs:
- Required fields on key objects. Don't let staff create an Opportunity without an Amount, Close Date, Stage, and Campaign. Don't let them create a Service Delivery without a linked Program Engagement and date. Validation rules enforce this; culture reinforces it.
- Naming conventions. Decide on a Campaign naming format (e.g., "FY26 – Year-End Appeal – Email") and stick to it. Same for Programs, Services, and any custom objects. Without naming conventions, your reports will have five variations of the same campaign name, and filtering becomes a nightmare.
- Deduplication routines. Run duplicate checks on Contacts and Accounts monthly at minimum. Duplicate donor records mean inaccurate giving totals, missed stewardship touches, and embarrassing double-asks. Salesforce has built-in duplicate rules and matching rules - turn them on.
Build Reports and Dashboards That Nonprofits Actually Use
A common pattern in nonprofit Salesforce orgs: someone builds 40 reports during implementation, creates a few dashboards, and within three months nobody opens any of them. The reports answered the wrong questions, the dashboards mixed audiences, and the data wasn't trustworthy enough to present to anyone external.
Here's how to avoid that.
Start with NPSP Reports (Then Customize)
If you're running NPSP, don't start from scratch. Salesforce publishes an NPSP Reports Workbook - a PDF and Trailhead-based resource that walks through pre-built report templates mapped directly to the NPSP data model. It covers:
- Donation summaries by fiscal year, quarter, and month
- Donor acquisition and retention reports
- Recurring donation health (active, lapsed, upgraded, downgraded)
- Campaign performance with ROI calculations
- Household giving totals
These reports use standard NPSP objects and fields. Install them, verify they return accurate data for your org, and then customize from there - adjusting filters, adding columns, or creating summary formulas specific to your fiscal year or segmentation needs.
Practical tip: Before customizing anything, run each pre-built report and compare the output against a number you already know. If your finance team says you received $420,000 in donations last fiscal year, the NPSP donation summary report should return the same number. If it doesn't, you have a data quality issue to fix before building anything else.
Program Impact Reporting with PMM
PMM gives you the objects. Now you need reports that answer funder and board questions about program performance. Three report types you'll use most:
- Service Delivery Summary — a summary report grouped by Program, then by Service, showing count of Service Delivery records and total units delivered. This answers "how much did we deliver, and in which programs?"
- Program Engagement Status — a tabular or summary report showing all Program Engagements filtered by status (Active, Completed, Withdrawn). Group by Program to see enrollment and completion rates side by side.
- Outcome Achievement — if you're using PMM's outcome tracking, a report filtered to completed engagements showing outcome results. This answers "of the people who finished our program, how many achieved the target outcome?"
Example: A refugee resettlement agency runs three programs - employment services, English language classes, and housing assistance. Their quarterly funder report needs participant counts, services delivered, and outcomes per program. With PMM, that's three reports (one per metric type), each grouped by Program. Total build time after the data model is in place: under an hour.
Three Dashboard Types You Should Separate
Separate your dashboards by audience. Three is usually enough.
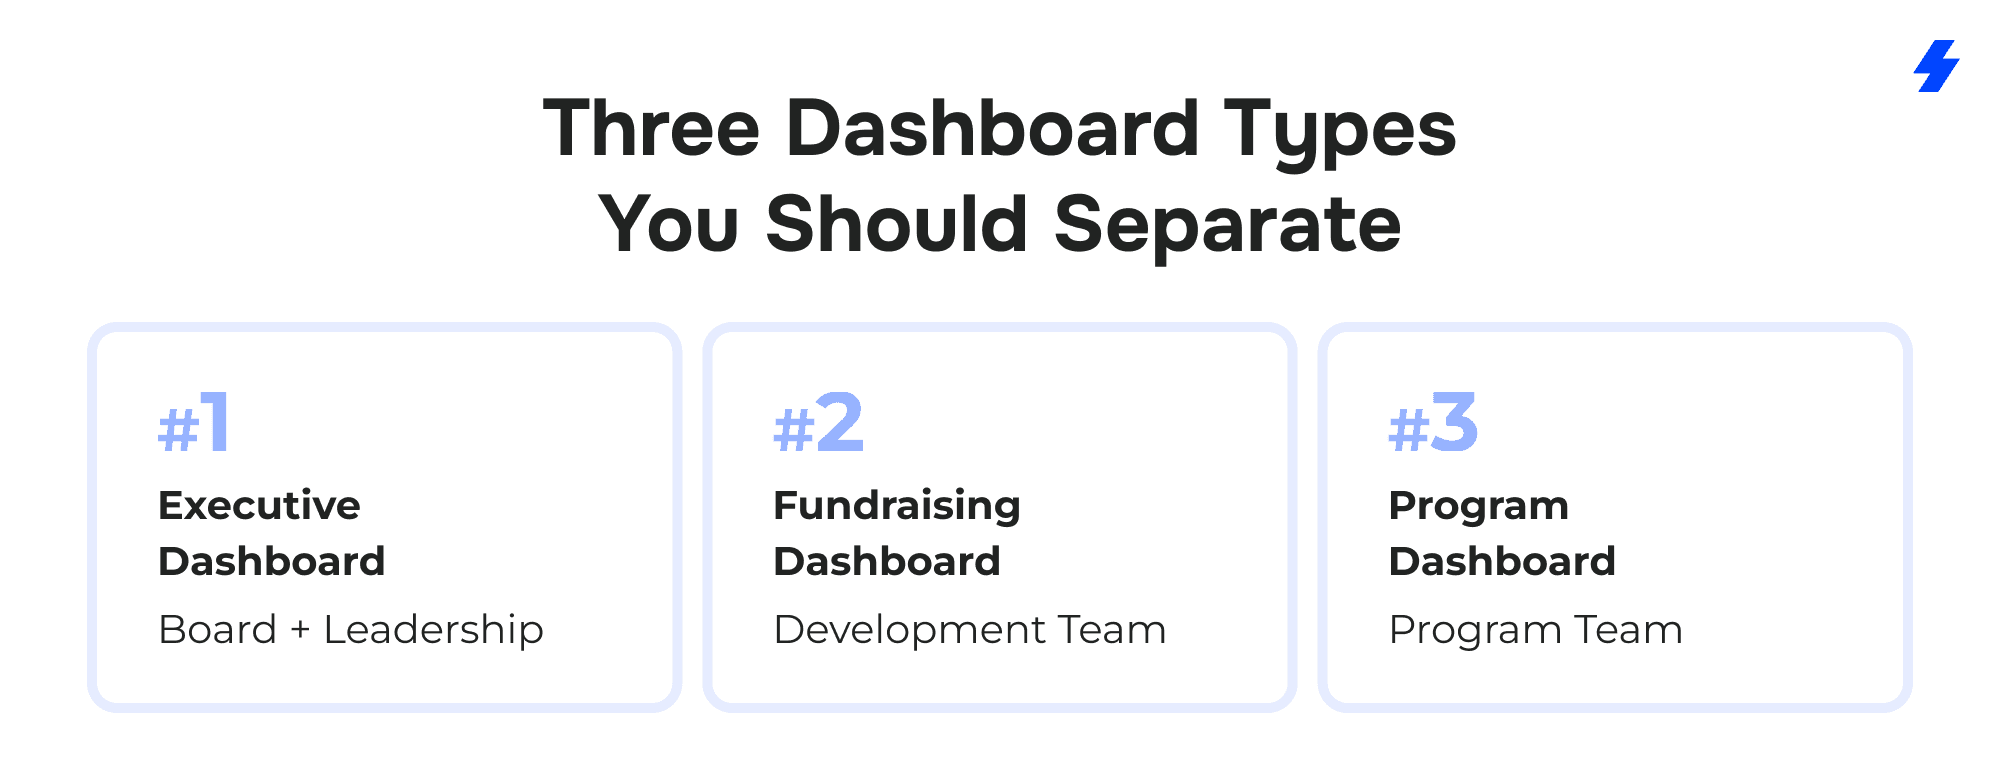
- Executive Dashboard (Board + Leadership). This is the dashboard your ED checks weekly and presents to the board quarterly. Keep it to 6–8 components max — total revenue vs. goal, donor retention, beneficiaries served, top-line program outcomes. Everything should be answerable in under 10 seconds per component. No drill-down required.
- Fundraising Dashboard (Development Team). A working dashboard the development director lives in daily. Pipeline by stage, recurring giving trends, lapsed donors, campaign performance, upcoming stewardship tasks. This one should surface problems early — not just celebrate wins.
- Program Dashboard (Program Team). Tracks delivery and outcomes, not dollars. Participants enrolled by program, services delivered, cohort completion rates, and the outcome metrics your funders require.
Why separation matters beyond clarity: Salesforce dashboards respect running user permissions. When your board dashboard runs as the ED, board members see org-wide numbers without needing access to individual donor records. When your program dashboard runs as a program manager, it can display participant-level data that the board shouldn't see. Mixing audiences on one dashboard either over-exposes data or forces you into the lowest common denominator of access.
How to Automate Reporting in Salesforce
Building reports is the first step. The second step - the part that actually saves your team hours every month - is automation. You don't want your grants manager manually running a report, exporting it to Excel, reformatting it, and emailing it to the funder every month. You want Salesforce to handle the repetitive parts so your team spends time interpreting data, not assembling it.
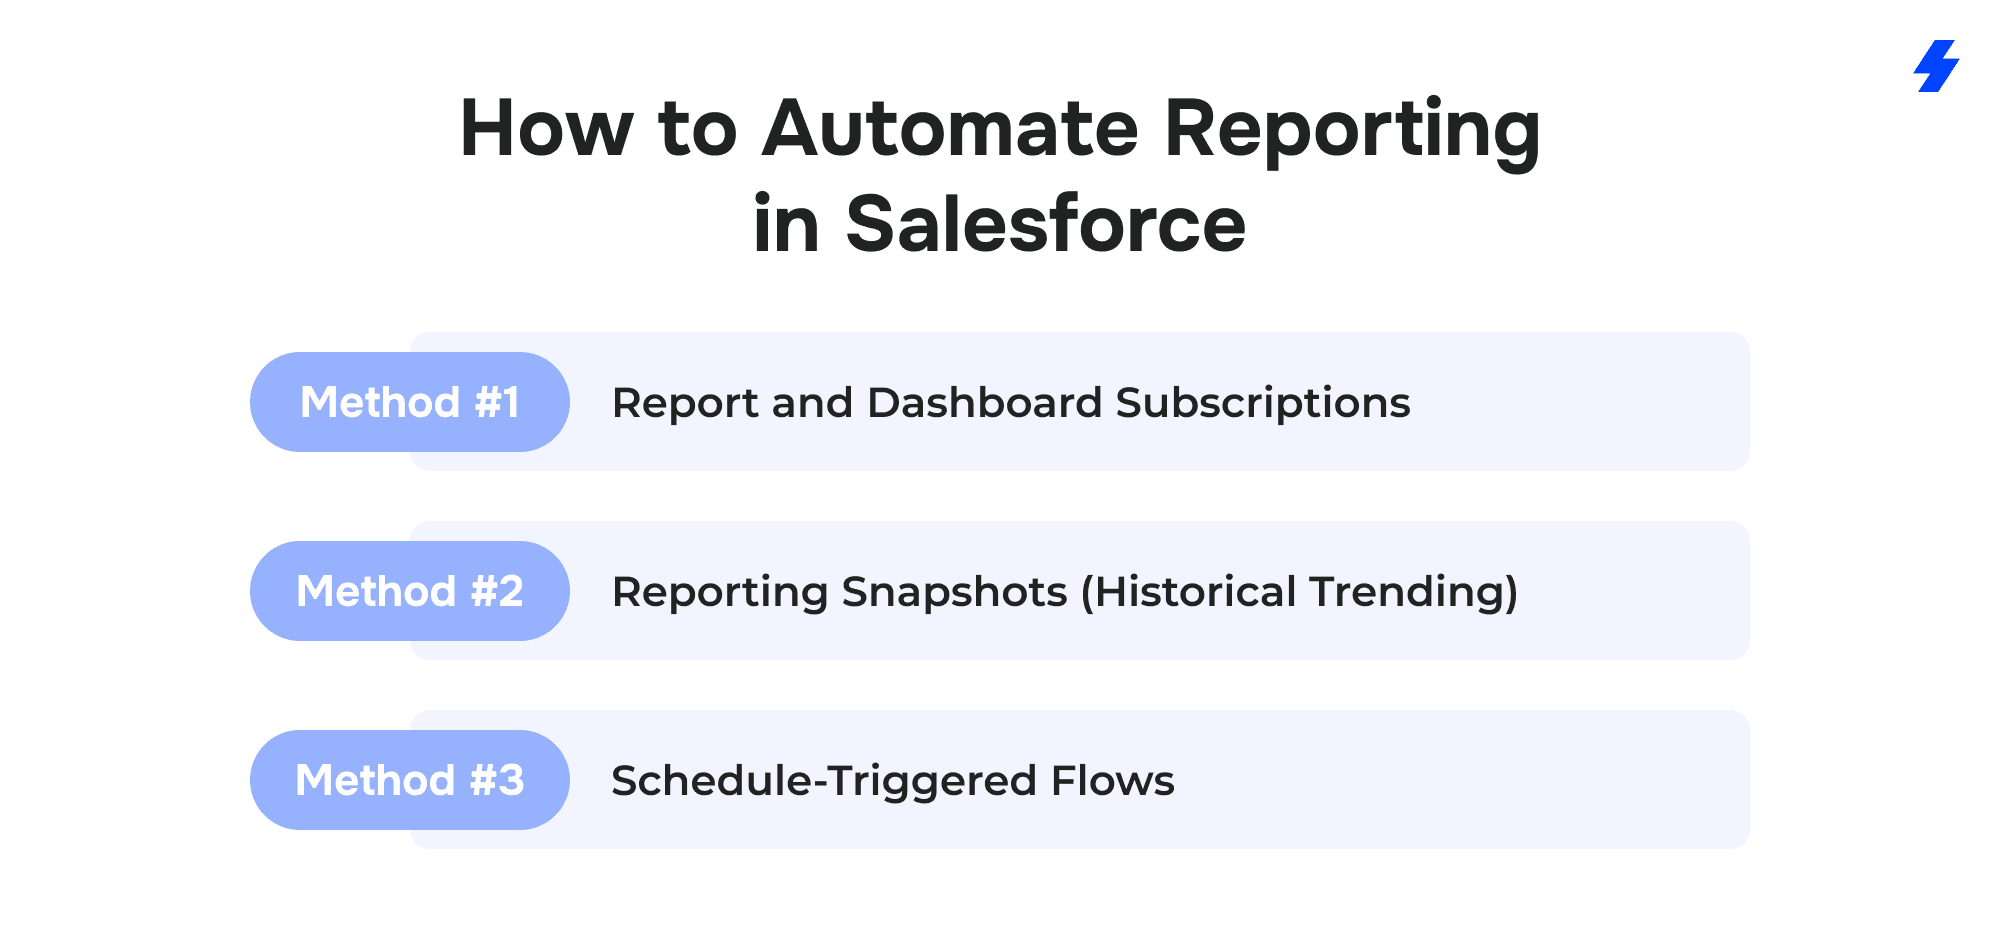
Salesforce gives you three native automation methods for reporting, plus an optional advanced path. Each solves a different problem.
Method 1: Report and Dashboard Subscriptions
What it does: Sends a report or dashboard to specified recipients on a schedule (daily, weekly, monthly) as an email with results attached or rendered inline.
Best for: Recurring stakeholder updates where the recipients just need to see current numbers.
How it works:
- Open any report or dashboard in Salesforce.
- Click Subscribe (top right).
- Set the frequency (every weekday, weekly on Monday, first Monday of the month, etc.).
- Choose recipients - individual users, or a public group.
- Add conditions if you want (e.g., only send if the record count exceeds a threshold).
- Save.
That's it. Salesforce emails the report results on schedule.
Where nonprofits use this:
- Weekly fundraising summary to the development team every Monday morning.
- Monthly volunteer hours report to the volunteer coordinator on the 1st.
- Dashboard snapshot to the ED every Friday.
Limitations:
- Subscriptions send a point-in-time snapshot. If someone opens the email on March 5th for a report that ran on March 1st, they're seeing March 1st data. That's usually fine, but it means you can't use subscriptions alone for historical trend analysis.
- The recipient needs to be a Salesforce user (or you need to use a workaround like email-to-group forwarding).
- You're limited in formatting - it's a standard Salesforce report email, not a polished PDF.
Method 2: Reporting Snapshots (Historical Trending)
What it does: Captures the results of a report at a scheduled interval and stores them in a custom object. Over time, this builds a historical dataset you can report on, showing how a metric changed month over month, quarter over quarter.
Best for: Any metric that changes over time where you need to preserve the value as it was on a specific date. Think: month-end donation totals, donor counts, active recurring gifts, participants enrolled.
Why this matters for nonprofits: Standard Salesforce reports show live data. If you run a "total donations this fiscal year" report on March 31st, it shows one number. If you run it on April 5th after a few late gifts get entered and backdated, it shows a different number. For board reporting, funder reporting, and financial reconciliation, you often need the number as it was on a specific date. Reporting snapshots solve this.
How it works:
- Build the source report (the report whose results you want to capture).
- Create a custom object to store the snapshot data (e.g., "Monthly Fundraising Snapshot" with fields for Date, Total Revenue, Donor Count, Average Gift, etc.).
- In Setup → Reporting Snapshots, create a new snapshot linking the source report to the target object.
- Set the schedule (e.g., last day of every month at 11 PM).
- Each time it runs, Salesforce writes the report results into new records on the target object.
- Once you have several months of snapshots, you build reports and dashboards on the snapshot object itself, giving you month-over-month trend lines.
Example: A nonprofit's grants manager needs to report quarterly spend against budget. Each month, a reporting snapshot captures total expenditures per grant as of the last day of the month. By the end of the quarter, the snapshot object holds three data points per grant. The quarterly funder report pulls from these snapshots, showing a clean month-by-month spend progression, without anyone manually recording numbers in a spreadsheet.
Limitations:
- You need to create the target custom object and map fields manually. It's a one-time setup cost, but it's not zero-configuration.
- Snapshots are limited to 2,000 rows per run. If your source report returns more than 2,000 rows, you'll need to split it.
- The schedule options are basic; you can't trigger a snapshot based on an event, only on a time schedule.
Method 3: Schedule-Triggered Flows
What it does: Runs automated logic on a schedule - querying records, updating fields, sending notifications, creating records, or any combination. Unlike subscriptions and snapshots, Flows can transform and prepare data, not just capture or email it.
Best for: Data preparation and cleanup before reporting. Alerts when something needs attention. Multi-step automation that goes beyond "send this report."
Important note: If you come across older guidance that references Process Builder, use Flow Builder instead for any new automation. Process Builder is deprecated. Flow is the current and only recommended automation framework. Build everything new in Flow.
Where nonprofits use Schedule-Triggered Flows for reporting:
- Pre-reporting data cleanup. A Flow runs on the 28th of each month, checks all Opportunities closed this month for missing Campaign assignments or blank fields, and sends the development team a summary of records that need attention before month-end reports run.
- "Report-ready" flags. A Flow evaluates each Program Engagement at the end of the quarter. If all required outcome fields are populated, it checks a "Report Ready" checkbox. Your funder report filters on Report Ready = True, so incomplete records don't pollute the numbers.
- Threshold alerts. A Flow runs weekly, calculates the current donor retention rate (or any other rolling metric), and sends a Slack notification or email to the development director if it drops below a defined threshold — say, 40%.
- Rolling up child data for parent-level reporting. A Flow runs nightly, counts Service Delivery records per Program for the current month, and writes the total to a "Services Delivered This Month" field on the
- Program record. Your executive dashboard reads from this rolled-up field instead of running a real-time aggregation, which keeps dashboard load times fast.
Limitations:
- Flows require more Salesforce admin skill than subscriptions or snapshots. You (or your admin) need to be comfortable with Flow Builder, understanding scheduled paths, record lookups, loops, and assignments.
- Schedule-Triggered Flows run in the background. Debugging requires checking Flow execution logs in Setup.
- Complex Flows can hit Salesforce governor limits (query limits, DML limits) if not designed carefully. For high-volume orgs, bulkification matters.
Automation Method Decision Guide
A quick reference for choosing the right method:
- "I need to email a report to stakeholders on a schedule." → Report or Dashboard Subscription. Simple, fast, no configuration beyond the subscribe button.
- "I need month-end numbers to stay fixed so they don't change retroactively." → Reporting Snapshot. Capture it once, store it permanently, report on the historical data.
- "I need to clean up or prepare data before reports run." → Schedule-Triggered Flow. Flag incomplete records, fill in missing fields, send reminders to staff.
- "I need reminders sent when a metric crosses a threshold." → Schedule-Triggered Flow with email or Slack alert actions.
- "I need advanced visualizations, cross-object analytics, or predictive models." → CRM Analytics (formerly Tableau CRM) or Tableau. This is the enterprise path — powerful, but with a steeper learning curve and additional licensing cost. Worth mentioning, not worth implementing until you've outgrown native reports and dashboards.
In practice, most nonprofits end up using all three native methods together. Subscriptions handle distribution. Snapshots handle historical preservation. Flows handle data preparation and alerting. They're complementary, not competing.
Ready-to-Use Report Packs (Templates Nonprofits Can Copy)
Below are five report packs. Each one is designed for a specific stakeholder group and includes the reports, KPIs, data sources, and automation method you'd wire up in Salesforce. Treat these as starting templates, adapt the KPIs to your org, but keep the structure.
Pack 1: Board Pack (Monthly or Quarterly)
Audience: Board of Directors, Executive Director
Purpose: High-level organizational health.
Reports to include:
- Revenue vs. Annual Goal — summary report on Opportunities (Closed Won), grouped by month, with a running total and annual target for comparison.
- Donor Retention Rate — cross-fiscal-year comparison of unique donors. How many donors from last fiscal year gave again this year?
- Major Gifts Pipeline — summary of Opportunities at each stage above a dollar threshold (e.g., $10,000+), showing total expected revenue and weighted pipeline value.
- Beneficiaries Served — PMM-based report counting unique Contacts with active or completed Program Engagements this period.
- Program Outcome Highlights — one or two headline metrics from your most visible programs (e.g., job placement rate, housing stability rate).
- Budget Burn Rate — if you track budget data in Salesforce or integrate with accounting, a simple spend-vs-budget summary by quarter.
Automation method: Reporting snapshots (capture month-end numbers on the last day of each month) + a dashboard subscription emailing the board dashboard to a distribution list on a set schedule — the 1st business day of the month or the Monday before each board meeting.
Pack 2: Funder / Grant Pack (Per Reporting Cycle)
Audience: Grants Manager, Program Directors, external funders
Purpose: Grant-specific performance data that maps directly to what's required in funder reports. Every grant has different deliverables, but the structure is consistent.
Reports to include:
- Deliverables Completed vs. Planned — a report on milestone or deliverable records linked to the grant, showing status (complete, in progress, overdue) and completion dates.
- Participants Enrolled and Served — PMM report filtered to the specific program(s) funded by this grant, showing enrollment count, services delivered, and unique participants.
- Spend vs. Budget — if budget line items are tracked in Salesforce, a summary showing allocated vs. spent by category. If not, this gets pulled from your accounting system and referenced alongside the Salesforce data.
- Outcome Metrics — whatever the grant agreement specifies. This is where your KPI definitions from the
- Reporting Blueprint pay off — the metric in Salesforce should match the metric in the grant agreement word for word.
- Timeline / Milestone Status — a tabular report showing upcoming and overdue milestones with responsible staff.
Automation method: Reporting snapshots to lock in monthly or quarterly numbers + a Schedule-Triggered Flow that sends reminders to program staff 14 days before each grant reporting deadline, flagging any records missing required fields.
Pack 3: Fundraising Operations Pack (Weekly)
Audience: Development Director, fundraising staff
Purpose: This is the operational pulse of your fundraising program. It should surface problems early - a drop in recurring gifts, a spike in lapsed donors, an underperforming campaign - before they show up in the board report.
Reports to include:
- Gifts Received This Week / Month / Quarter — summary report on Opportunities (Closed Won), grouped by close date, with totals. Compare against the same period last year.
- Donor Retention and Churn — donors who gave last year but haven't given this year, segmented by giving level. This is your "at risk" list.
- Recurring Gift Health — count and total value of active recurring donations, plus new starts, upgrades, downgrades, and cancellations this month.
- Campaign ROI — for each active campaign, total raised vs. total cost, response rate, and average gift.
- Lapsed Donors List — tabular report of individual donors who've lapsed, sorted by lifetime giving value. This becomes your re-engagement call list.
Automation method: Report subscriptions — the weekly summary emails every Monday. For the lapsed donor list, a Schedule-Triggered Flow runs monthly, identifies lapsed donors above a giving threshold, and creates follow-up Tasks assigned to the appropriate fundraiser.
Pack 4: Program Impact Pack (Monthly)
Audience: Program Managers, M&E (Monitoring and Evaluation) staff
Purpose: Tracks what your programs are actually delivering and achieving. This is the data that feeds into funder reports, annual reports, and impact communications.
Reports to include:
- Services Delivered by Program — PMM summary report grouped by Program → Service, showing count of deliveries and total units. This answers "what did we deliver this month?"
- Participant Cohort Status — Program Engagements grouped by Program and Status (Active, Completed, Withdrawn). Shows enrollment trends and dropout rates.
- Outcome Achievement by Program — for programs with defined outcomes, a report showing the percentage of completed participants who achieved target outcomes.
- Participant Demographics — if your org tracks demographic data on Contact records, a summary showing program participation by age, geography, gender, or other segments relevant to your mission and funders.
- Waitlist / Capacity — if applicable, a report showing programs at or near capacity, with waitlisted participants.
Automation method: Reporting snapshots to capture monthly service delivery totals and outcome rates (these numbers need to stay stable for quarterly and annual reporting). A Schedule-Triggered Flow runs on the 25th of each month, checks Program Engagements for missing outcome data on participants whose programs ended that month, and notifies program staff to complete records before month-end.
Pack 5: Volunteer Pack (Monthly)
Audience: Volunteer Coordinator, Program Managers
Purpose: Tracks volunteer engagement, utilization, and contribution to programs. Often overlooked in Salesforce implementations, but critical for organizations that rely on volunteers for service delivery.
Reports to include:
- Total Volunteer Hours This Month — summary report on Volunteer Hours records (or your custom equivalent), grouped by program or campaign.
- Hours by Program / Event — breakdown showing which programs consume the most volunteer time. Useful for cost allocation and grant reporting where volunteer hours count as in-kind match.
- Shift Fill Rate — for organizations that schedule volunteer shifts, the percentage of available slots that were filled. Low fill rates signal recruitment or scheduling problems.
- Top Volunteers — a ranked list by hours contributed, useful for recognition programs and stewardship.
- Active vs. Inactive Volunteers — count of volunteers who logged hours in the last 90 days vs. those who haven't. The inactive list becomes a re-engagement target.
Automation method: Report subscriptions: monthly summary to the volunteer coordinator. A Schedule-Triggered Flow runs quarterly to flag volunteers who haven't logged hours in 90+ days, updating their status to "Inactive" and optionally creating a re-engagement Task.
Best Practices for Implementation
These aren't aspirational. They're the things that separate nonprofit Salesforce orgs that actually use their reports from the ones that abandon them after six months.
Data quality rules. Make Amount, Close Date, Stage, and Campaign required on Opportunities. Make Service Date and Program Engagement required on Service Deliveries. If staff can skip fields, they will — and your reports will be wrong.
Naming conventions. Pick a format for Campaigns (e.g., "FY26 – Year-End Appeal – Email"), Programs, and Services. Document it. Enforce it. Without this, you'll have five variations of the same campaign name and no clean way to filter reports.
Deduplication. Run duplicate checks on Contacts and Accounts monthly. Salesforce has built-in duplicate and matching rules — turn them on. Duplicate donor records mean inflated counts, missed stewardship, and unreliable giving totals.
Quarterly data audits. Once a quarter, have each data owner review their domain. Development reviews donor data. Program staff review PMM records. Volunteer coordinator reviews hours. Flag and fix gaps before they compound.
Report ownership. Every report and dashboard should have a named owner — the person responsible for confirming the data is accurate and the report still serves its purpose. Orphaned reports are how you end up with 200 reports and zero trust.
Documentation. Maintain three living documents: a KPI dictionary (definitions + filter logic), a report inventory (which reports exist, who owns them, what they answer), and an automation schedule (what runs when, and who gets notified).
Security, Privacy, and Access Controls for Nonprofit Reporting
Nonprofits handle sensitive data — donor giving history, beneficiary personal information, program participation records. Your reporting setup needs to respect that.
Role-based access. Use Salesforce roles and profiles to control who sees what. Board members viewing an executive dashboard don't need access to individual donor records. Program staff don't need to see major gift pipeline details.
Field-level security. Restrict sensitive fields (donor SSN/tax ID, beneficiary health information, income data) to only the roles that need them. Even if a report technically includes those records, field-level security ensures restricted fields display as blank for unauthorized users.
Separate dashboards by audience. This was covered earlier, but it's a security practice as much as a usability one. Running dashboards as specific users controls the data scope each audience sees.
Limit what gets emailed. Report subscriptions send data via email — which means it leaves Salesforce's security perimeter. Avoid subscribing reports that contain PII or sensitive beneficiary data. For external stakeholders, use Salesforce Experience Cloud portals or secure links instead of email attachments.
Audit trails. Enable field history tracking on sensitive objects (Opportunities, Contact fields with PII). If you ever need to show a funder or auditor who changed what and when, this is how.
Implementation Roadmap
A realistic four-phase rollout for reporting and automation. Don't try to do everything in week one.
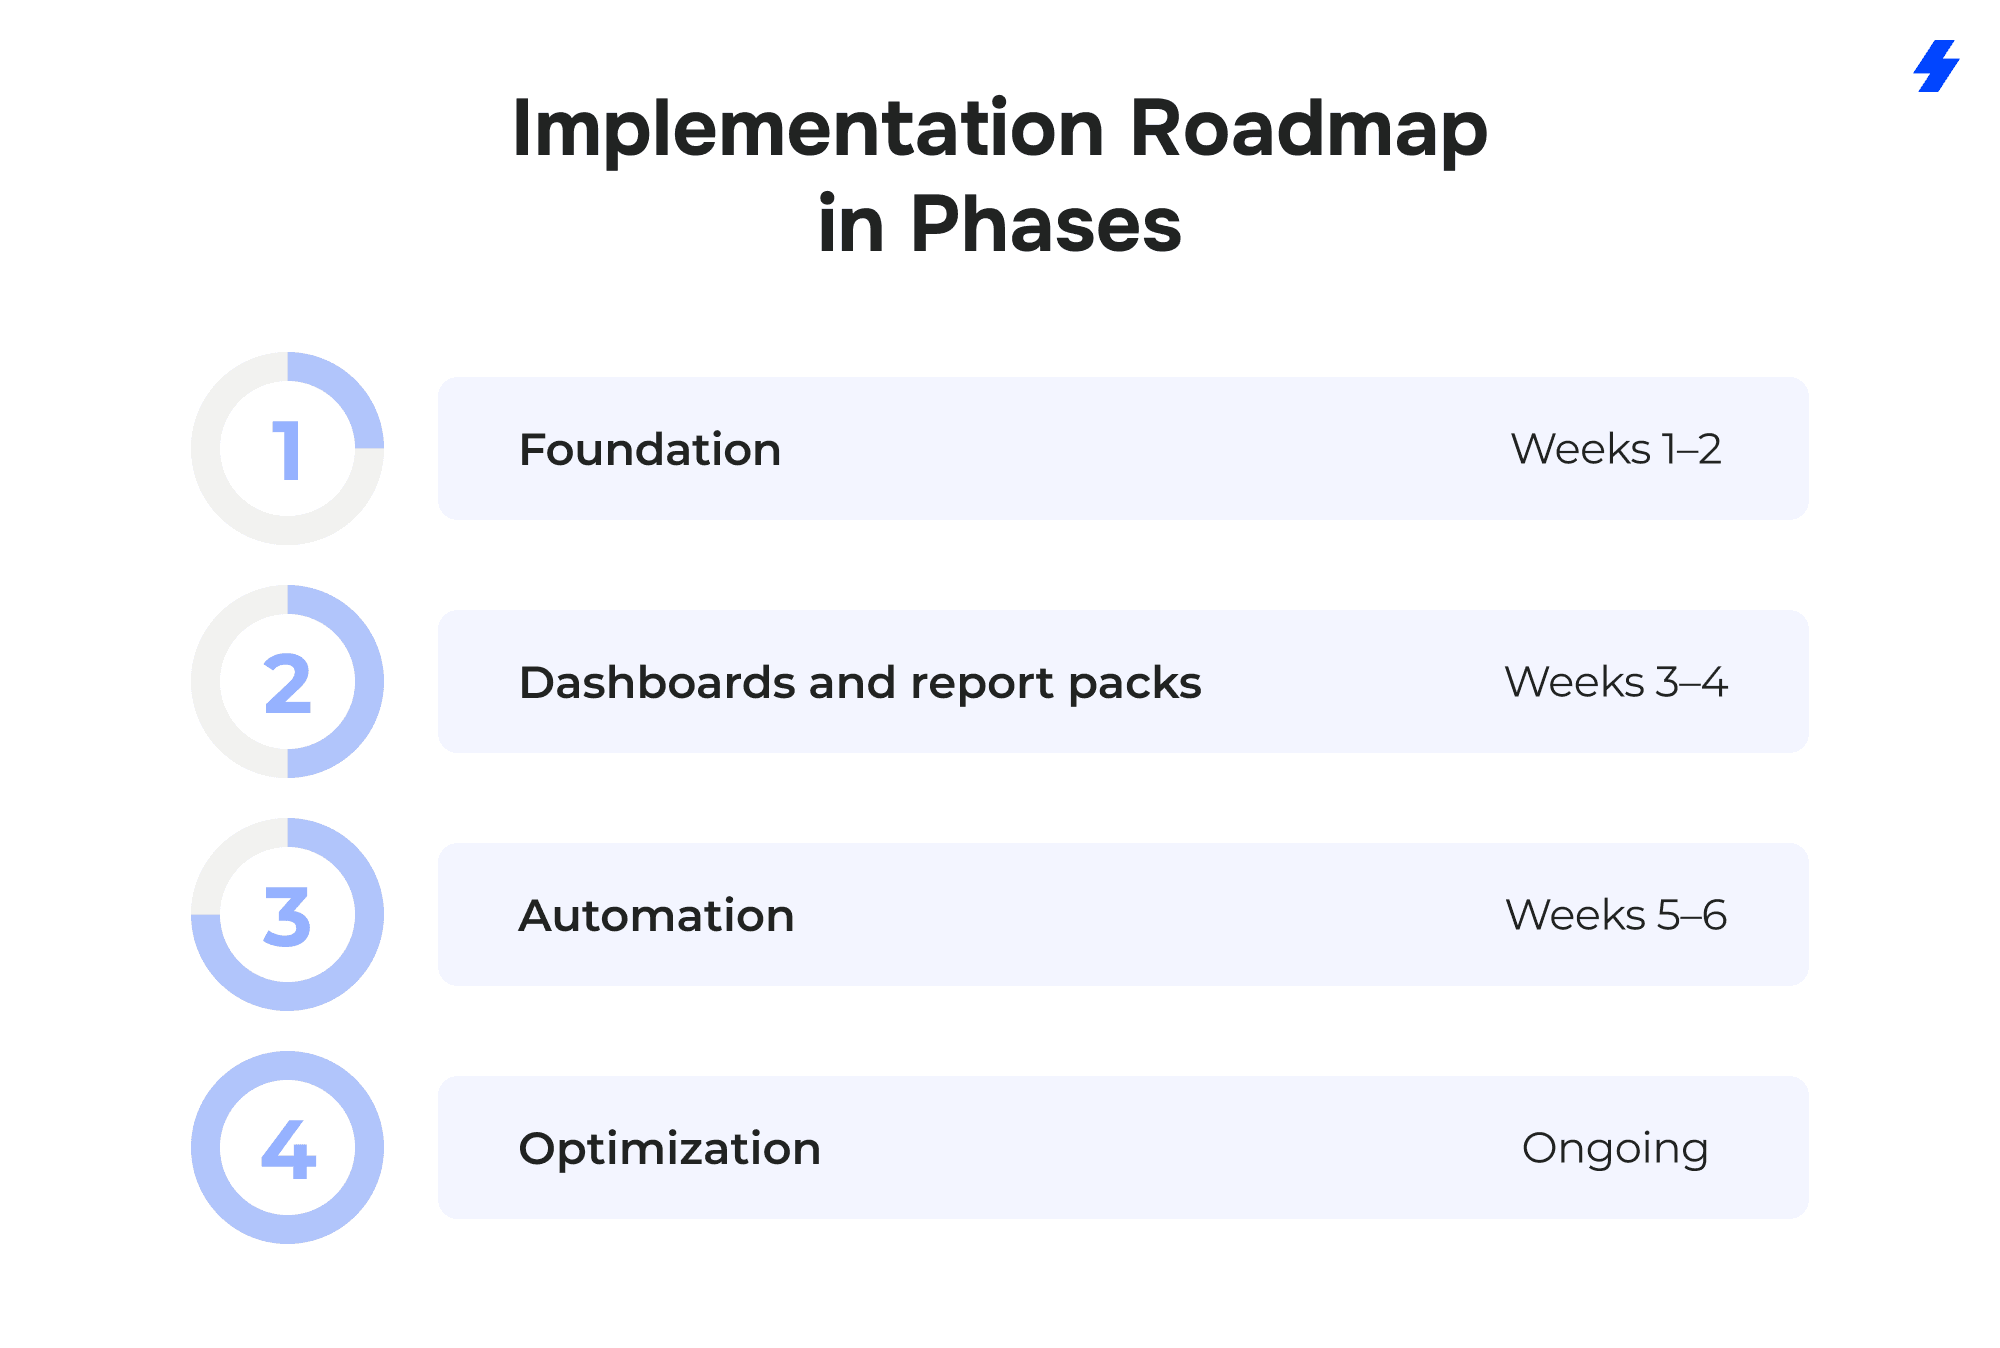
Phase 1 (Weeks 1–2): Foundation
Finalize KPI framework and Reporting Blueprint. Run data cleanup: deduplicate Contacts, fill in missing required fields, standardize naming. Build 5–10 baseline reports that match your current manual reporting. Validate numbers against known benchmarks.
Phase 2 (Weeks 3–4): Dashboards and report packs
Build the three separated dashboards (Executive, Fundraising, Program). Assemble report packs from the templates in this guide. Assign report owners. Get stakeholder sign-off that dashboards answer their actual questions.
Phase 3 (Weeks 5–6): Automation
Set up report subscriptions for weekly/monthly distribution. Configure reporting snapshots for month-end data capture. Build Schedule-Triggered Flows for data cleanup reminders and threshold alerts. Test each automation through one full cycle before going live.
Phase 4 (Ongoing): Optimization
Review dashboards quarterly: remove unused components, add new ones as needs evolve. Audit data quality monthly. Retrain staff as turnover happens. Document every change in your report inventory and automation schedule.
How MagicFuse Helps
 If your team doesn't have the bandwidth or Salesforce expertise to build this from scratch, MagicFuse works with nonprofits to:
Run a reporting audit — inventory your existing reports, map them against stakeholder needs, identify gaps, and build a KPI dictionary tailored to your org.
Set up automation — configure subscriptions, reporting snapshots, and Schedule-Triggered Flows so your reporting runs itself.
Review your security model — ensure donor and beneficiary data is protected with appropriate role-based access, field-level security, and dashboard permissions.
Provide ongoing managed services — monthly admin support, quarterly data audits, and report optimization as your org evolves.
Ready to Get Your Nonprofit Reporting Right?
Building reports is easy. Building reports your board, funders, and program teams actually trust takes a clear framework, clean data, and the right automation setup.
If your team needs help auditing your current Salesforce reporting, setting up automation, or building the report packs and dashboards covered in this guide, MagicFuse can help. We work with nonprofit organizations to turn Salesforce into a reporting system that runs on schedule.
FAQs
- What is the best way to use Salesforce for nonprofits?
Start by defining what your organization needs to track — donor relationships, program delivery, volunteer management, or all three. Implement Nonprofit Cloud (or NPSP + PMM if you're on an existing Salesforce license), build a KPI framework before creating reports, and automate distribution so stakeholders get data without manual effort. Nonprofits that treat Salesforce as a centralized, integrated platform for fundraising, programs, and operations — rather than a contact database — consistently report positive ROI. In fact, Salesforce's nonprofit customers have reported a 93% positive return on investment after implementation.
- What's the difference between Nonprofit Cloud, NPSP, and the Program Management Module?
Salesforce Nonprofit Cloud is natively embedded in the Salesforce platform and comes preloaded with nonprofit-specific functionality — fundraising, case management, outcome management, and program enrollment — without needing a separate installation. The Nonprofit Success Pack (NPSP) is a free managed package that nonprofits install on top of Sales Cloud to add donor management, household accounts, and campaign management features. It's ideal for small- to mid-sized nonprofit organizations with straightforward needs and tighter budgets. The Program Management Module (PMM) is a separate free package that adds program delivery and service delivery tracking. Salesforce recommends that new customers use Nonprofit Cloud, but continues to support NPSP for existing users.
- How do nonprofits automate reporting in Salesforce?
Three native methods: report/dashboard subscriptions (scheduled email delivery), reporting snapshots (capture point-in-time data for historical trending), and Schedule-Triggered Flows (data cleanup, reminders, threshold alerts). These automated workflows replace routine tasks like manually pulling reports, reformatting spreadsheets, and emailing stakeholders — which can reduce manual workloads by up to 60%. Most orgs use all three methods together.
- What are reporting snapshots and when should we use them?
Reporting snapshots capture report results at a scheduled interval and store them in a custom object. Use them when you need month-end or quarter-end numbers to stay fixed — for board reports, funder reports, or financial reconciliation where retroactive data changes would cause discrepancies. They're especially valuable for grant compliance, where funders expect numbers that don't shift between reporting cycles.
- How do I create board-ready reports that run automatically every month?
Build a reporting snapshot to capture month-end KPIs (revenue, donor count, beneficiaries served). Build an executive dashboard that reads from the snapshot object. Subscribe the dashboard to email your board distribution list on the 1st business day of each month. The entire setup uses native Salesforce reporting features — no third-party tools required.
- What KPIs should nonprofits track for fundraising and impact?
At minimum: donor retention rate, total revenue vs. goal, recurring giving growth, cost per dollar raised, beneficiaries served, services delivered, and program outcome achievement rates. Salesforce also provides AI-driven insights through Einstein that can predict donor behavior, identify high-value prospects, and surface data-driven insights from live dashboards on fundraising performance. Define each KPI precisely — filter logic, time period, owner — before building reports.
- How do we effectively manage donor relationships effectively in Salesforce?
Salesforce eliminates fragmented spreadsheets by storing donor, volunteer, and beneficiary information in one place — providing a 360-degree view of all constituents. Staff can track detailed donor histories, including giving patterns and communication preferences, to personalize outreach. The platform tracks various gift types — individual, recurring, and grants — alongside campaign management tools to manage the entire donor lifecycle. You can also link program outcomes directly to donor records for automated impact reporting, which builds trust and improves donor engagement over time.
- How do we secure donor and beneficiary data in reports?
Use role-based access and field-level security to control who sees sensitive fields. Separate dashboards by audience. Avoid emailing reports that contain PII — use Experience Cloud portals for external sharing. Enable field history tracking for audit purposes. This is particularly important for nonprofit sector handling program participant data, beneficiary health information, or grant compliance records.
- Can Salesforce track program outcomes and impact reporting?
Yes. Salesforce Nonprofit Cloud includes features for program and outcome management natively — allowing nonprofits to define, track, and evaluate the impact of their programs. PMM provides the core objects (Programs, Engagements, Services, Service Deliveries) for organizations on NPSP. Both support reporting on services delivered, participant status, program enrollment trends, and outcome achievement. You can also track volunteer management data — hours, shifts, skills — and connect it to program delivery for a complete operational picture.
- How many free Salesforce licenses can nonprofits get?
Eligible nonprofit organizations receive 10 free Enterprise Edition licenses through the Power of Us Program. To qualify, your organization must be recognized as a charitable, nonprofit, or social change organization in your country — 501(c)(3) or 501(c)(4) status in the US. Educational institutions are also eligible. These free licenses can be used for either Nonprofit Cloud or Sales/Service Cloud. Additional licenses beyond the initial 10 are available at discounted nonprofit pricing.
- What does Salesforce Nonprofit Cloud pricing look like?
Nonprofit Cloud Enterprise Edition starts at $60/user/month, Unlimited at $100/user/month, billed annually. Nonprofit Cloud Agentforce editions (for Sales or Service) run $325/user/month. Grantmaking editions start at $175/user/month. Eligible nonprofits can receive 10 free licenses through Power of Us. NPSP itself is free — but it requires an existing Salesforce license to run on. When budgeting, account for implementation, data migration, training, and ongoing maintenance — not just license costs.
- When should a nonprofit use Tableau or CRM Analytics?
When you've outgrown native Salesforce reporting features — typically when you need cross-object analytics spanning multiple data sources, advanced visualizations, predictive modeling, or real-time data blending from external systems like Data Cloud. For most nonprofit organizations, native reporting covers 80–90% of needs. Start there, and consider the advanced features of Tableau or CRM Analytics only when your reporting requirements genuinely demand it.
- What should we consider when implementing Salesforce for a nonprofit?
Work with a certified Salesforce implementation partner to ensure your system is configured for your organization's unique needs. Create a data migration plan before importing anything. Establish internal champions who support the Salesforce solutions journey and drive adoption. Schedule regular data audits to maintain data hygiene. Document your configuration decisions for continuity and troubleshooting. And build a 90-day roadmap covering CRM setup, user configuration, data import, and training — strategic planning upfront prevents expensive rework later.