






 If your managed package has ever stalled in AppExchange Security Review, there’s a decent chance the reason wasn’t a real vulnerability. It was a scan gap.
I’ve seen it happen more than once: a team runs Salesforce Code Analyzer, gets a clean report, and submits, not realizing Salesforce requires a second, separate scan through Checkmarx before it will even look at the app. The two tools check different things, and passing one says nothing about the other.
I went through this exact sequence recently on a client submission, and it’s what convinced me to write it down properly.
Below is what actually happened on that submission, followed by the checklist I now run on every one: what each scan catches, how to run Salesforce Code Analyzer v5 against your codebase, how to read and act on a Checkmarx report, and what changed now that Chimera, Salesforce’s old dynamic scanner, is gone.
What Happened on My Last ISV Submission
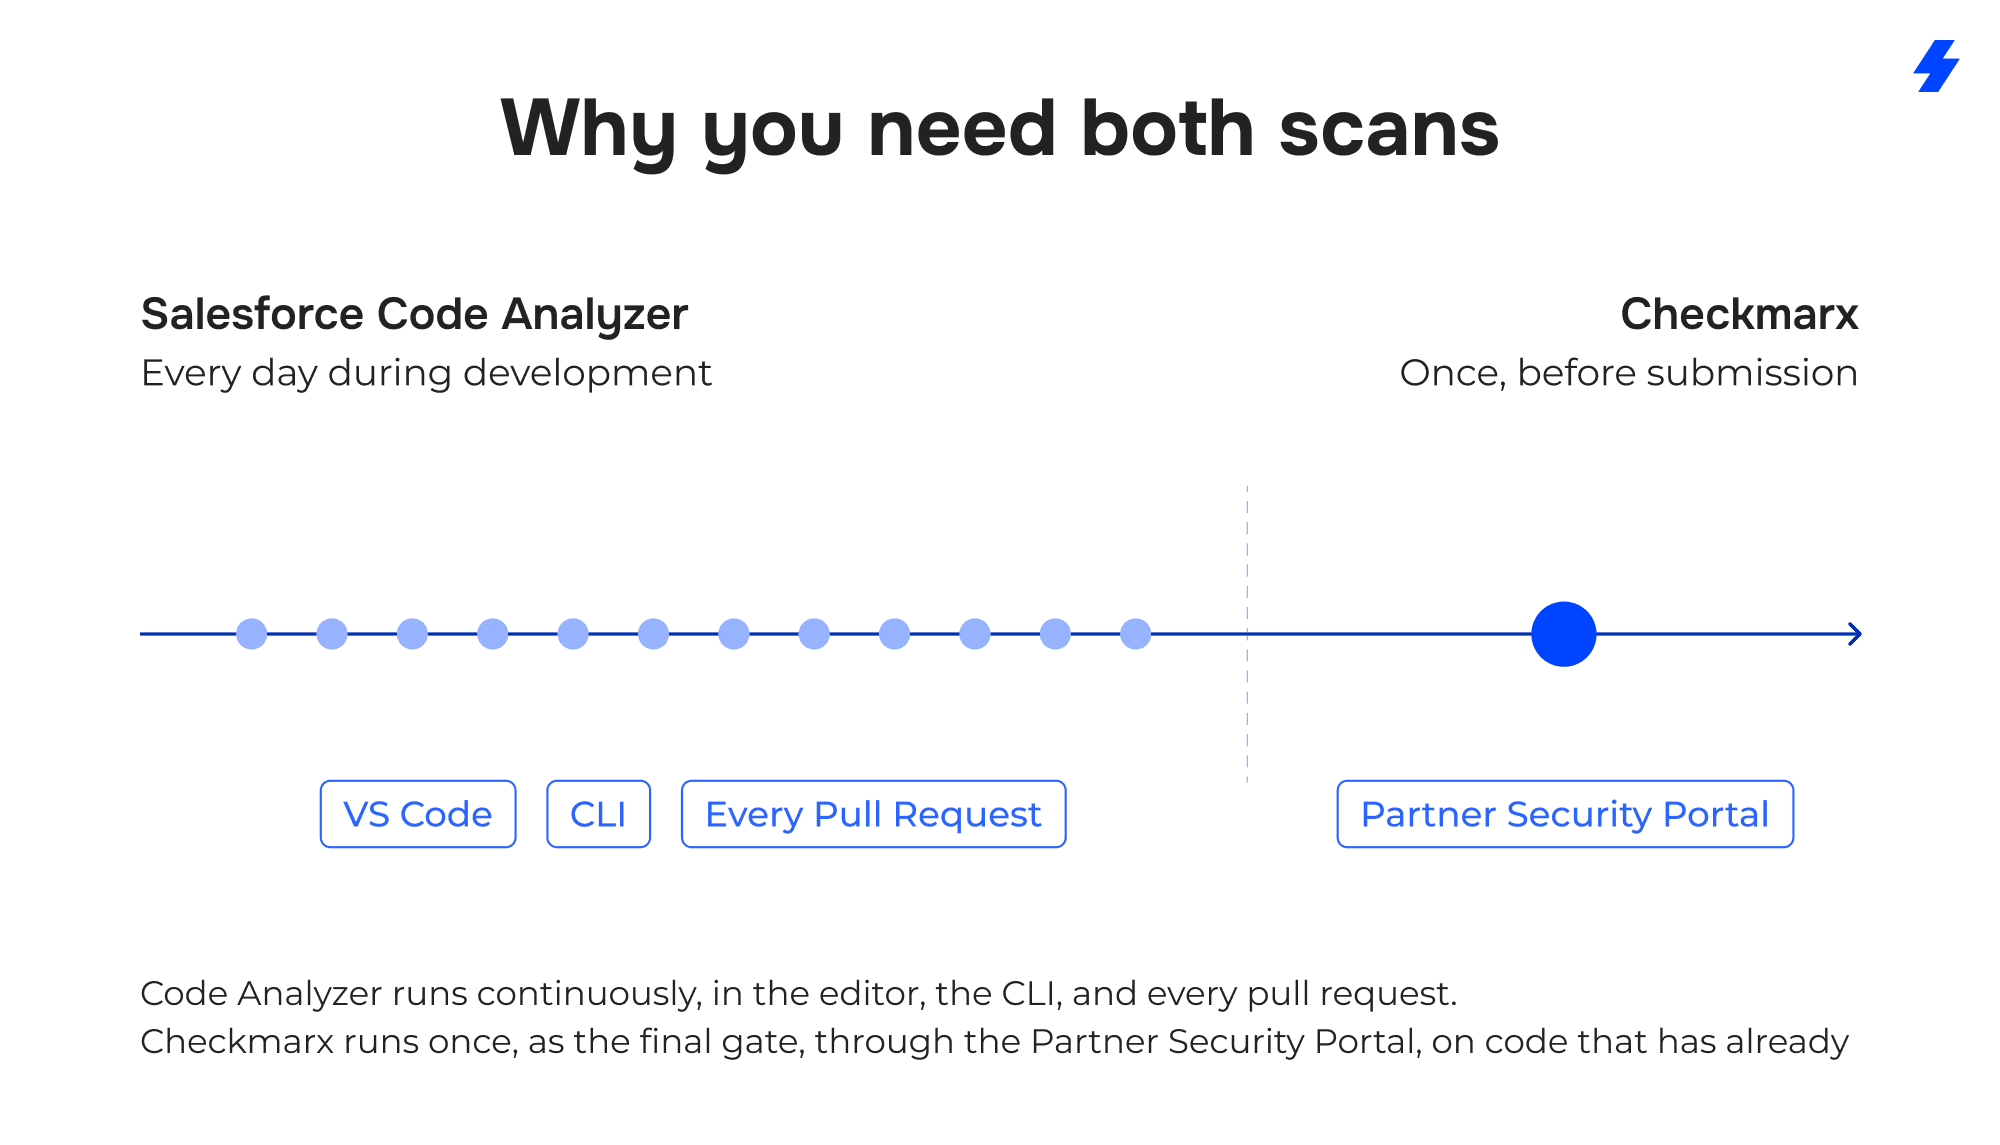
I went through this recently on a submission for a client, and the tools mattered less than the order I used them in. Salesforce Code Analyzer came first and stayed with me the whole way — running locally while I wrote code, and in CI on every pull request.
I used the exact command from the ISVforce Guide, sf code-analyzer run --rule-selector AppExchange --rule-selector Recommended:Security, on version 5, because version 4 is retired and Salesforce won't support it anymore. By the time I opened the Partner Security Portal to run Checkmarx, it wasn't telling me anything new. It just confirmed what I'd already fixed.
That's the whole point. If Checkmarx is where you first meet a problem, you've left it too late and you've spent one of very few scans finding out.
The app also talked to external systems, so a static scan wasn't enough. I ran OWASP ZAP against those endpoints myself. This used to be Chimera's job, and Salesforce retired Chimera in June 2025, so now the dynamic scan is on you: you pick the tool, you run it, you attach the report. If your package lives entirely inside Salesforce with no outside calls, you can skip this. If it calls anything, plan for it early — it's not a step you want to discover a week before submitting.
The thing I'd tell anyone doing this for the first time has nothing to do with rules or vulnerabilities. It's how the Checkmarx scan actually behaves. It only scans unpackaged code in the org you point it at. Code that's already inside a managed or unmanaged package gets skipped.
So you have to scan your real packaging org, that org has to be linked to your publisher account in the Partner Community, and the Author Apex account you submit with has to belong to that org and use a business email — not Gmail, not a personal domain. Miss any of that and Salesforce doesn't see you as a partner. Instead of your 3 free scans per review, you land under the 360,000-lines-of-code-per-year limit. And 3 scans is not many.
The last part is the unglamorous part, and it's where most of the time actually goes. I go through the findings and split them into real issues and false positives.
I fix one thing at a time and test each fix on its own, so I know what changed.
Then I write up every remaining flag and explain why it isn't a real risk. Salesforce doesn't need a perfect report, but it does want that write-up when flags are left over, and a documented false positive moves much faster through review than a red flag with no explanation next to it.
After that: a new Managed Released package version, because beta and unmanaged packages get rejected straight away; a regression pass; and a full walkthrough of the post-install setup on a completely fresh org.
That last check has saved me more than once. Manual configuration steps break in ways no scanner will ever warn you about. Then it's four to five weeks of waiting. And since each attempt on a paid app costs its own fee, that waiting is the best argument I know for being slow and careful before you hit submit.
That submission is why the rest of this is written as a checklist, not just a tools comparison. Here's the breakdown my team and I use on every ISV submission since.
Key Takeaways
- Salesforce requires two separate scans before Security Review: Salesforce Code Analyzer and the Checkmarx-powered Source Code Scanner. Neither substitutes for the other.
- Chimera, Salesforce’s bundled DAST scanner, was retired in June 2025. Partners now bring their own dynamic scanner for apps with external endpoints.
- Code Analyzer v5 replaced v4 as of August 2025. It’s an open-source, unified tool that wraps seven analysis engines under one CLI and ships over 500 built-in rules.
- A
code-analyzer.ymlconfiguration file lets you tune rule severities, tag rules by focus area, and write custom Regex rules for your team’s own coding standards. - You don’t need a perfect scan to submit. Salesforce’s own guidance is that documented, explained exceptions are an accepted part of the process.
Why Do You Need Both Salesforce Code Analyzer and Checkmarx Before Submission?
You need both because Salesforce’s own packaging documentation requires it outright. The ISVforce Guide states that the Code Analyzer scan is “in addition to the scan that you must complete using the Source Code Scanner, also referred to as the Checkmarx scanner.” One tool doesn’t stand in for the other, and Security Review checks for both reports.
The confusion is understandable. Both tools read your source code, Apex, Visualforce, Lightning Web Components, without executing it, which is the definition of static code analysis, and both produce a report of rule violations. But they’re built for different jobs, sit in different parts of your development process, and catch different security vulnerabilities.
What Salesforce Code Analyzer Checks
Code Analyzer is Salesforce’s own static analysis tool. It’s free for all Salesforce developers, open source (the source is public on GitHub), and built to run constantly: locally, inside your IDE, or as part of continuous integration. It’s the tool that helps you write high-quality, secure code before anything reaches a formal review.
What the Checkmarx Source Code Scanner Checks
The Source Code Scanner is a static scanning tool that uses Checkmarx security technology, and Salesforce treats it as the formal, submitted security scan for the review itself. It reads Apex, Visualforce and Lightning code, but it doesn't check a solution's external endpoints, and it doesn't work on mobile clients or API-only solutions. Each review cycle includes 3 free scans.
Why a Clean Code Analyzer Report Isn’t Enough
Here’s the comparison that matters when you’re planning your workflow:
Run Code Analyzer constantly across your entire codebase: during development, in code review, in your CI pipeline. Treat Checkmarx as the gate you walk through once your code is already clean, not the tool that finds your first round of problems.
What Changed When Salesforce Retired Chimera DAST in June 2025?
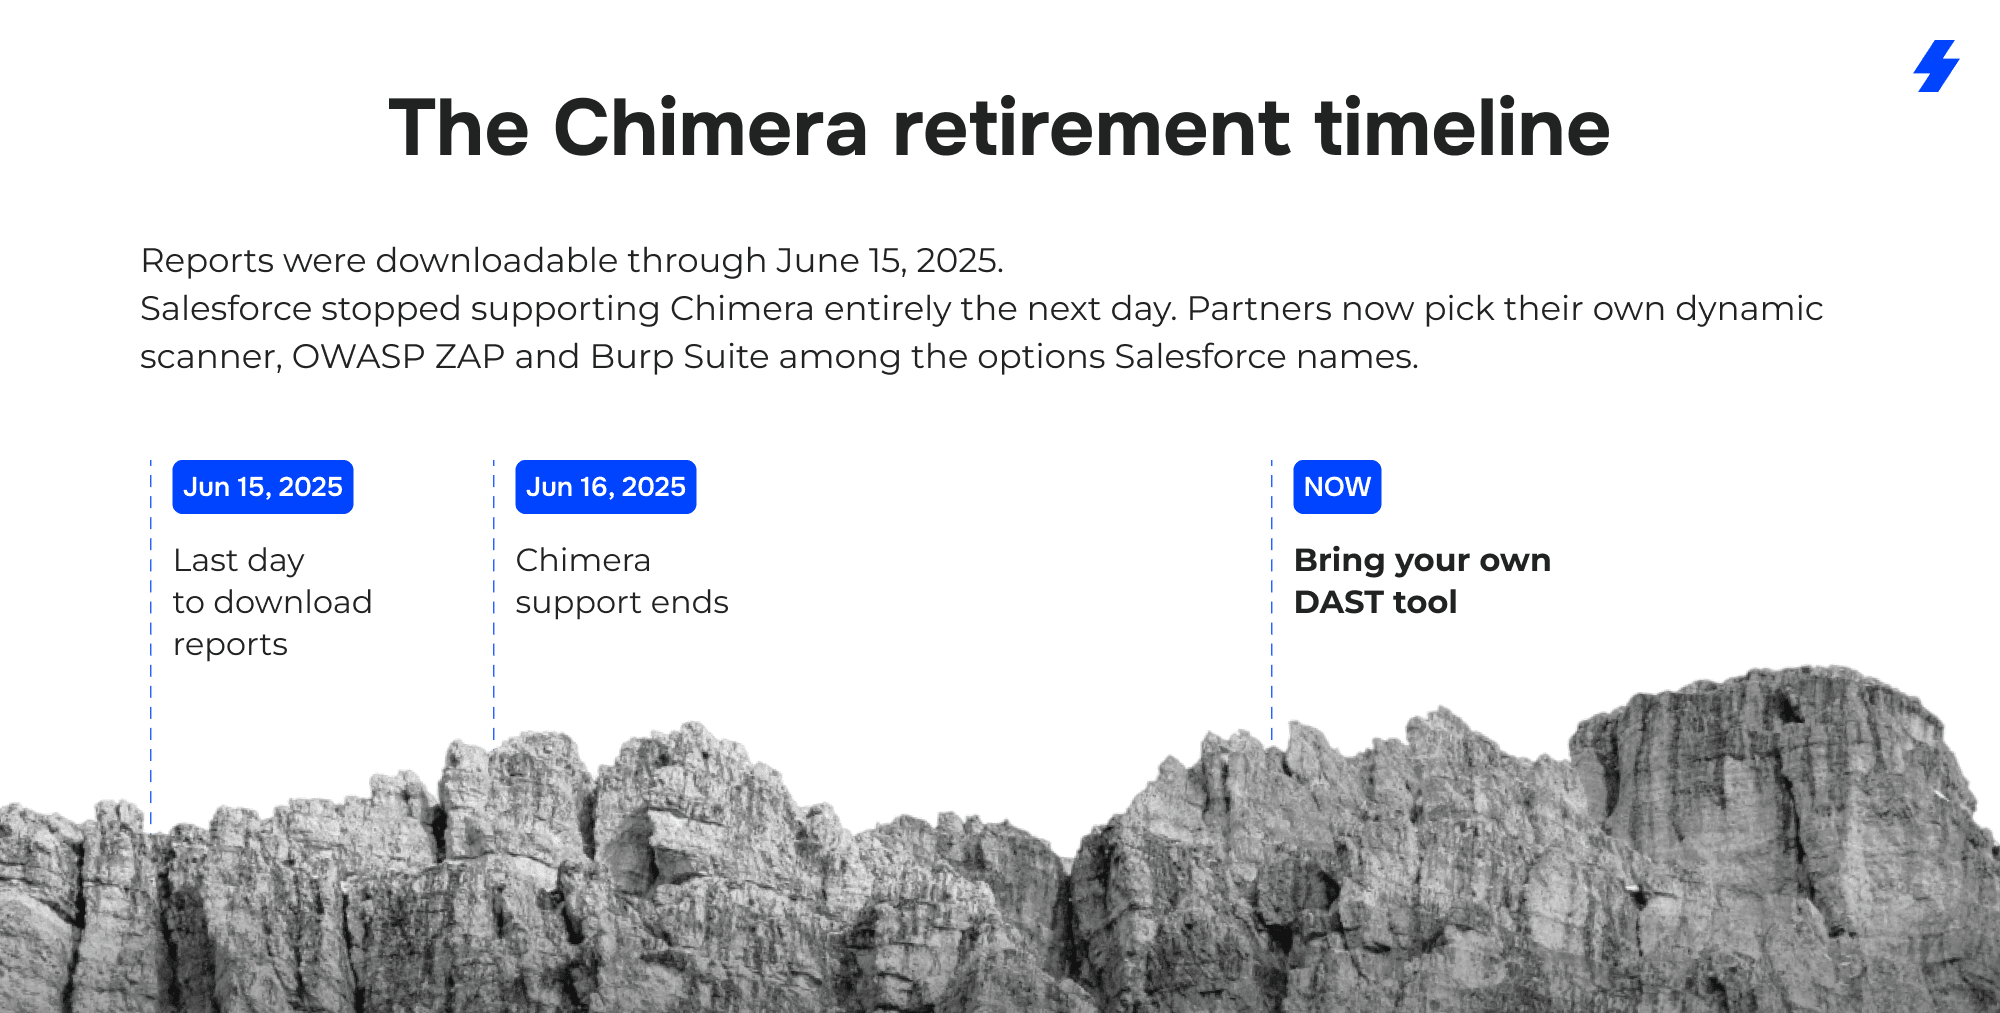
What changed is that Salesforce stopped providing a dynamic scanner as part of the Security Review process. Chimera, its dynamic application security testing (DAST) tool, was decommissioned, and partners now have to bring their own.
The Chimera Cutoff Dates
Salesforce’s Partner Security Portal states the cutoff plainly: partners had until June 15, 2025 to download any existing Chimera reports, and “Salesforce WILL NOT provide any support for Chimera DAST scans after June 16, 2025.” If your app has been through review before and you’re used to seeing Chimera in the process, that step is gone.
What Salesforce Recommends Instead
In Chimera’s place, Salesforce recommends a handful of established DAST tools: OWASP ZAP (free, open source), Burp Suite Enterprise Edition, Veracode, Intruder, and Acunetix. Which one you need depends on what your app actually exposes.
Does This Affect a Typical Managed Package?
If your managed package lives entirely inside the Salesforce platform, Apex, Visualforce, LWCs, no external servers or APIs of your own, a DAST scan usually isn’t part of your review at all. It only becomes relevant once your app talks to something Salesforce doesn’t run: your own hosted endpoints, a middleware layer, or a companion mobile app. If that’s your architecture, plan time to pick and run one of those tools before you submit, since it’s no longer bundled in.
How Do You Install and Run Salesforce Code Analyzer v5?
You install it as a Salesforce CLI plugin, then run it against your project workspace from the command line. As of August 2025, Code Analyzer v4 is retired and Salesforce no longer supports it, so v5 is the version to install regardless of what an older tutorial tells you.
Installing the CLI Plugin
You’ll need Salesforce CLI installed first. From there, install the new Code Analyzer CLI plugin with:
sf plugins install code-analyzer
Running Your First Security Review Scan
If you’re preparing for Security Review specifically, use the same command Salesforce documents in its own ISVforce Guide, which applies both the AppExchange-specific rule set and the general security rule set in one pass:
sf code-analyzer run --rule-selector AppExchange --rule-selector Recommended:Security --output-file CodeAnalyzerReport.html
The --rule-selector flag is a powerful rule selection mechanism on its own. Beyond running a named set like AppExchange, you can scope it down to filter by engine, category, severity, or a custom tag, right down to a single rule, when you’re chasing one specific issue instead of running a full scan.
Reading the HTML Report
That command scans your project workspace and writes an interactive HTML report you can filter, group, and drill into by severity or rule. Code Analyzer also supports multiple output types, CSV, XML, and JSON, if you need the results somewhere other than a browser, for a CI artifact or a custom dashboard, for example.
Getting Real-Time Feedback in VS Code
For day-to-day work, install the Salesforce Code Analyzer extension for Visual Studio Code. It runs the same rule engines in the background as you write Apex code or Lightning components, flags violations inline, and offers quick fixes for some of them, so you catch issues before they ever reach a full CLI scan. It’s one of a few IDE plugins worth having open while you work, alongside your usual linting setup.
How Do You Customize Code Analyzer for Your Project’s Rules?
You customize it through a single YAML configuration file, code-analyzer.yml, that you generate once, starting from a sensible default configuration, and check into your repository alongside the code it scans. This is also how you customize engine behavior across the board, rather than passing flags by hand on every run.
Modifying Existing Rule Properties
Lower a rule’s severity, from “high” to “low,” if it’s noisy for your codebase but not something you’re ready to fix yet. This is the fastest way to make a scan reflect how your team actually wants to prioritize its backlog, without disabling a rule entirely.
Tagging Rules by Focus Area
Tag rules and assign individual tags so a scan can target one focus area, security rules only, or performance rules only, without touching the rest. Development teams working across a large codebase tend to run a fast, security-tagged scan on every pull request and save the full sweep for release day.
Writing Custom Regex Rules
The Regex engine, new in v5, lets you write custom rules for conventions specific to your org that none of the built-in 500-plus rules know about: a banned method call, a required comment header, a naming pattern that keeps your code adhering to an internal standard. This is where org-specific and team-specific rules live.
The Engines Behind Code Analyzer v5
Code Analyzer runs on seven analysis engines under one interface, plus the Salesforce Graph Engine for the checks that need understanding of code execution flows, not just how one file looks in isolation.
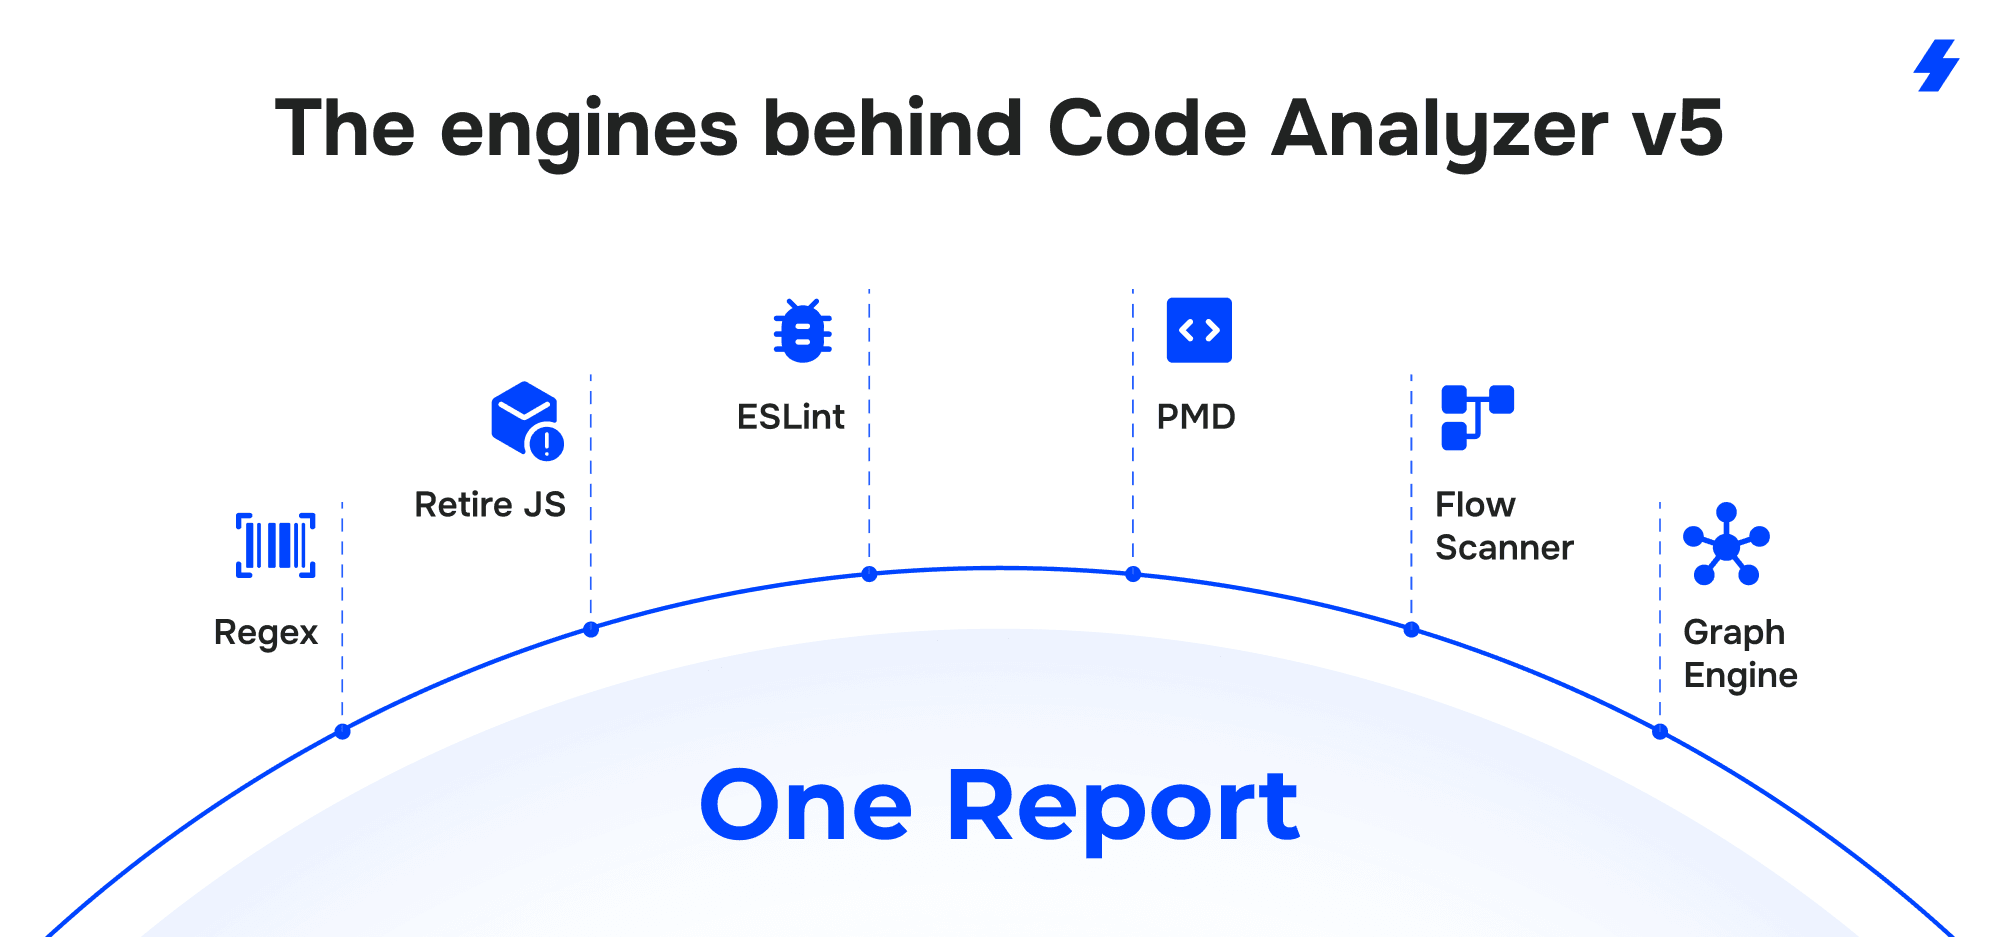
That last row is the one that separates Code Analyzer from a simple linter, and it’s also where performance bottlenecks and governor-limit issues tend to surface. A file-by-file scan can miss a SOQL injection risk if the tainted input and the vulnerable query sit in different methods.
The Graph Engine traces the path between them, which is closer to how an actual reviewer would read your code, including code an AI tool generated on your team’s behalf. AI-generated code runs through the same scan as anything else; the engine doesn’t care who or what wrote the method it’s tracing.
How Do You Get Through the Checkmarx Scan Without Surprises?
You get through it by treating your Code Analyzer runs as the discovery step and Checkmarx as confirmation, not the other way around. If Checkmarx is the first place you’re seeing a violation, you’ve skipped a step earlier in your development cycle.
Submitting Through the Partner Security Portal
Submit through the Partner Security Portal, where each review cycle includes 3 free Checkmarx scans. That’s not a lot if you’re used to running Code Analyzer dozens of times a week, so budget those scans for near-final code, not exploratory passes.
Handling False Positives Without Chasing Every Flag
Not every flag needs a code change. Salesforce’s own guidance on these scans is direct: it’s not necessary for a scan to be 100% passing before you submit. What Salesforce expects instead is that you’ve addressed what’s fixable, rerun the scan, and documented any remaining flags you believe are false positives, with your reasoning, as part of the submission. That documentation gives a reviewer actionable insights instead of an unexplained red flag, and it moves faster than a report with no context attached.
How Do You Build This Into a CI/CD Pipeline Instead of Running It by Hand?
You build it in with Salesforce’s official GitHub Action, which turns a manual scan into part of your continuous integration and deployment process.
The Official GitHub Action
run-code-analyzer is available on the GitHub Actions Marketplace. It accepts your checked-in code-analyzer.yml, lets you customize which arguments the scan runs with, and reports back an exit code plus rule violation counts by severity (critical, high, medium, low, info) directly in your workflow run, so your team gets detailed information without opening the HTML report every time.
Checking Your Action Version
One detail worth catching before you wire it up: version 2 of the action runs Code Analyzer v5. Version 1, now deprecated, still calls the retired v4. If your pipeline was set up before August 2025, check which version it’s pinned to.
Where to Put Each Gate: Pull Request vs. Release
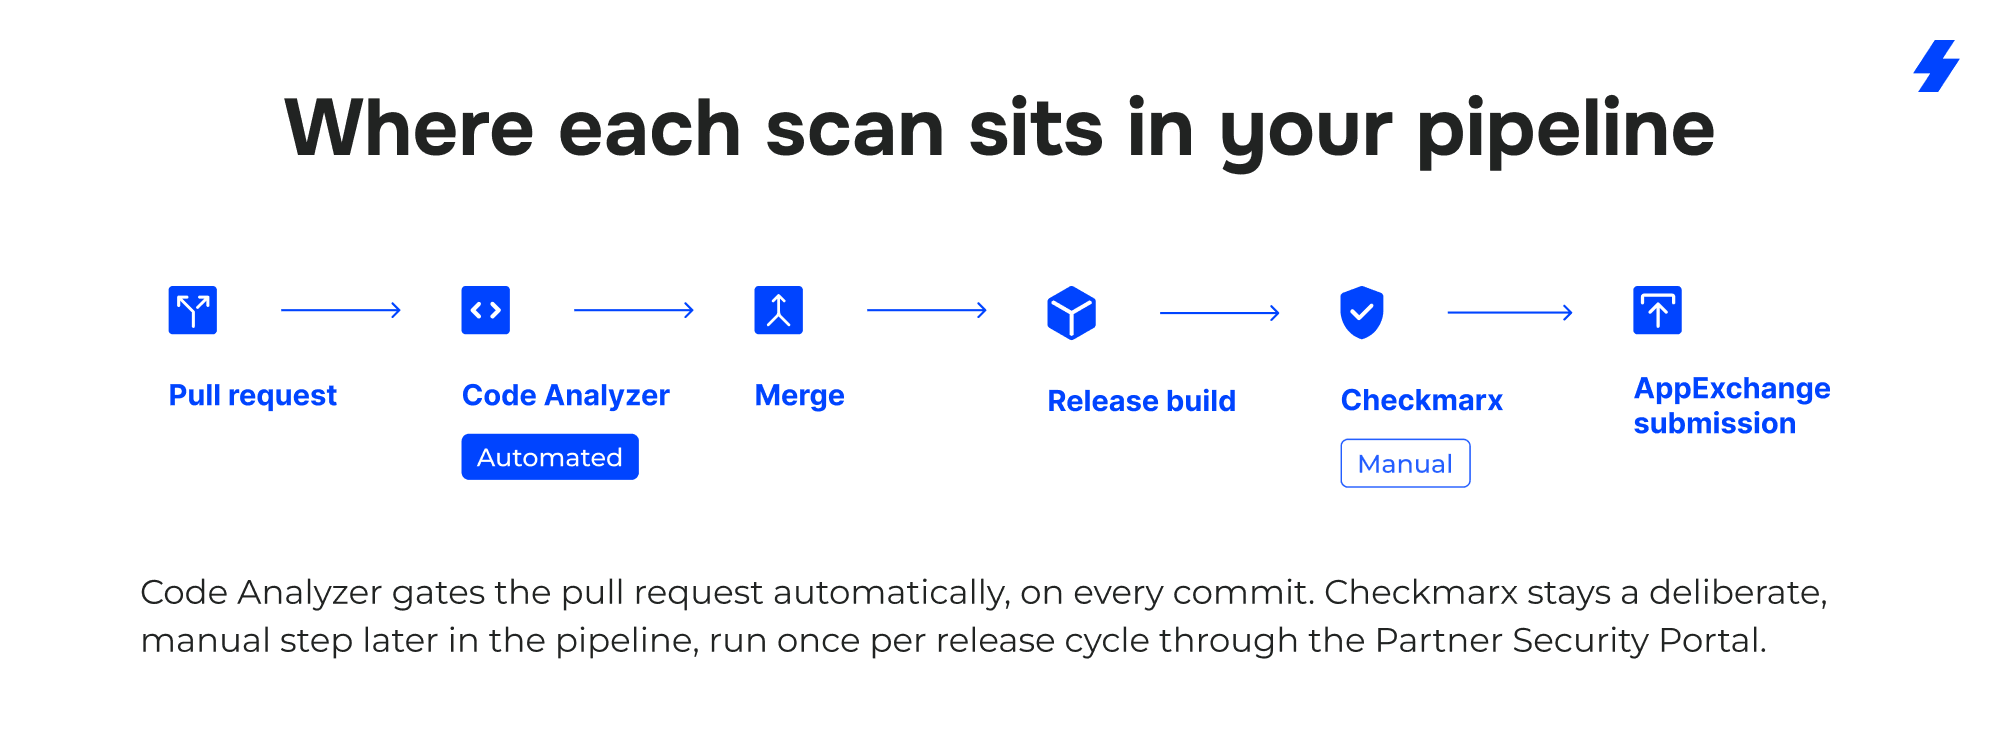
A sensible split for most teams: gate pull requests on new violations only, so a legacy file full of technical debt doesn’t block every unrelated merge, and treat a full, clean Code Analyzer run as a release gate before you touch Checkmarx at all. Checkmarx itself stays a manual, pre-submission step through the Partner Security Portal. It isn’t built to run on every commit, and with only 3 free scans per cycle, you don’t want it to.
How Has MagicFuse Helped ISVs Clear These Scans Before Security Review?
We’ve built and maintained managed packages for AppExchange ISVs for over 12 years, and Security Review readiness is a normal part of that work, not a one-time favor before launch.
Elements.cloud: A Managed Package That Passed Every Review
For Elements.cloud, we built a secure, scalable AppExchange managed package with a custom logging system to work around Salesforce platform limits and detailed monitoring across the stack. It passed all security reviews, from Salesforce and from external security firms the client engaged separately.
Atamis: Rebuilding Security Review Readiness Into an Existing App
For Atamis, a UK procurement platform, we took over an app originally built without much Salesforce-specific production experience, much of it still on Visualforce with little Lightning coverage. We worked it through a proper Security Review preparation process alongside ongoing feature development, and it went on to earn strong AppExchange reviews after launch.
NDA-Protected ISVs We’ve Helped the Same Way
We’ve done the same for ISVs we can’t name publicly: a UK-based e-signature platform that needed its AppExchange app rebuilt for code quality and security before it could pass review, and a US real estate platform where getting a legacy codebase debugged and cleaned up was the difference between a stalled submission and a passed one.
Across MagicFuse’s 270+ Salesforce certifications and 15+ ISV products supported, this scan-and-fix cycle — Code Analyzer during development, Checkmarx before submission — is close to a routine step for our Salesforce developers.
Where This Leaves You
Two scans, not one. Code Analyzer stays open in your editor and in your pipeline, catching issues as you write them and helping your code adhere to your own team’s standards along the way. Checkmarx is the formal check you run once, near the end, through the Partner Security Portal, on code that’s already been through the first filter. Chimera’s gone, so if your app has an external footprint, a DAST tool is now something you choose, not something Salesforce hands you.
None of this is complicated once you’ve run it a few times. It’s just easy to get wrong the first time, which is usually the time it costs you the most: a delayed launch, a second submission fee, a partner or investor asking why the app isn’t live yet. Reproducing this checklist correctly for review is what a lot of ISVs bring us in for, and it’s the kind of work our security review team does every week.
FAQs
- What is Code Analyzer in Salesforce?
It’s a free, open-source static code analysis tool from Salesforce that scans Apex, Visualforce, Lightning Web Components, and Flows for code quality, security, and performance issues without running the code. It combines multiple analysis engines and ships over 500 built-in rules, and it’s available through the Salesforce CLI, a Visual Studio Code extension, and GitHub Actions.
- Is Salesforce Code Analyzer free?
Yes. It’s free for all Salesforce developers to install and run as often as you like, whether from the CLI, inside VS Code, or in a CI pipeline.
- Is Code Analyzer the same as PMD?
No, though PMD is one of the engines inside it. Code Analyzer wraps PMD together with ESLint, RetireJS, a Regex engine, and Flow Scanner under one CLI and one report, so you don’t have to configure and run each tool separately.
- Do I still need Checkmarx if my Code Analyzer scan is clean?
Yes. Salesforce’s packaging documentation requires the Checkmarx-powered Source Code Scanner as a separate, mandatory scan for AppExchange submission. A clean Code Analyzer report is a good sign, not a substitute.
- What happened to Chimera DAST?
Salesforce retired it in June 2025. Partners could download old Chimera reports through June 15, 2025, and Salesforce stopped supporting it entirely after June 16, 2025. Partners now choose their own DAST tool, such as OWASP ZAP or Burp Suite, for apps that need dynamic testing.
- How is Code Analyzer v5 different from v4?
Salesforce retired v4 as of August 2025. Version 5 was rebuilt around a single YAML configuration file, added the Regex and Flow Scanner engines, introduced a new CLI plugin with a simpler command structure, and added an interactive HTML report with filtering and drill-down. If you’re still running v4, Salesforce no longer supports it and won’t fix issues in it.