
Salesforce reports are one of the most valuable features for Salesforce CRM users. Intuitive, feature-rich, and customizable - what else can we need to get data-driven insights?
Explore our guide and discover Salesforce reports, their types, how to create them, and more!
What Is Salesforce report?
A Salesforce report is a standard object that gives you an easy way to view organized Salesforce data. With this report, you can analyze business data in numerous combinations, display it in easy-to-read formats, and share the information with others.
The value of these reports for businesses using Salesforce as their CRM platform is undeniable. In particular, they provide information critical for data-driven decision-making. Moreover, reports help track performance, make sales forecasts, and optimize processes. Finally, the platform updates content in real time and provides customization options, allowing you to tailor a report to your needs.
There are various types of Salesforce reports. We recommend studying them before you learn how to create reports.
Salesforce report types

A report format is a specific set of records and fields that meet certain criteria. In general, there are four Salesforce report types:
- Tabular reports
- Summary reports
- Matrix reports
- Joined reports
A Tabular format is the default one. However, if you need a different type, there are also Custom reports.
Here are more details about each type to help you get started with creating reports:
- Tabular
This report is similar to an Excel spreadsheet. Being the simplest type, it is suitable for displaying rows of data. Therefore, you can use this simple tabular report if you just need to display information without totals, calculations, etc.
Use a Tabular report for:
- Fast access to records
- Quick data export and share outside Salesforce
- Multiple records update
2. Summary
The Summary reports are similar to the Tabular reports. Still, users can analyze data grouped in rows, calculate totals, add easy-to-understand visuals, use three levels of data in one view, and create charts with a Summary report. This format is the most widely used among platform users.
Use a Summary report for:
- Data analysis by specific fields or time
- Data comparison across record groups
- A summary of key metrics
3. Matrix
With Matrix reports you can group records by rows and columns to see different totals. For example, group "Opportunities" by "Stage" and "Close Date". A Matrix report is Salesforce's most complex reporting format, typically used for comparing related totals.
Use a Matrix report for:
- Multi-dimensional data analysis
- Highly customized report creation
4. Joined
What makes Joined reports unique is the presentation of two separate reports to compare data. To illustrate, you can display "Open Opportunities" and "Closed Opportunities" in parallel to see differences. Here, you can use up to five report blocks. But note that reports can be joined only if they share common fields.
Use a Joined report for:
- General overview of sales performance data
- Analysis of data from different objects
- Putting different formats in one tab
5. Custom
You can create your own custom report type if none of the above suits you. Typically, users create Custom report types from scratch using their chosen combinations of fields and objects.
Use a Custom report for:
- A full overview of business data
- Reporting on multiple objects at a time
Now, let's move on to step-by-step instructions for creating Salesforce reports!
How to create Salesforce reports?
To create a Salesforce report, follow the steps below:
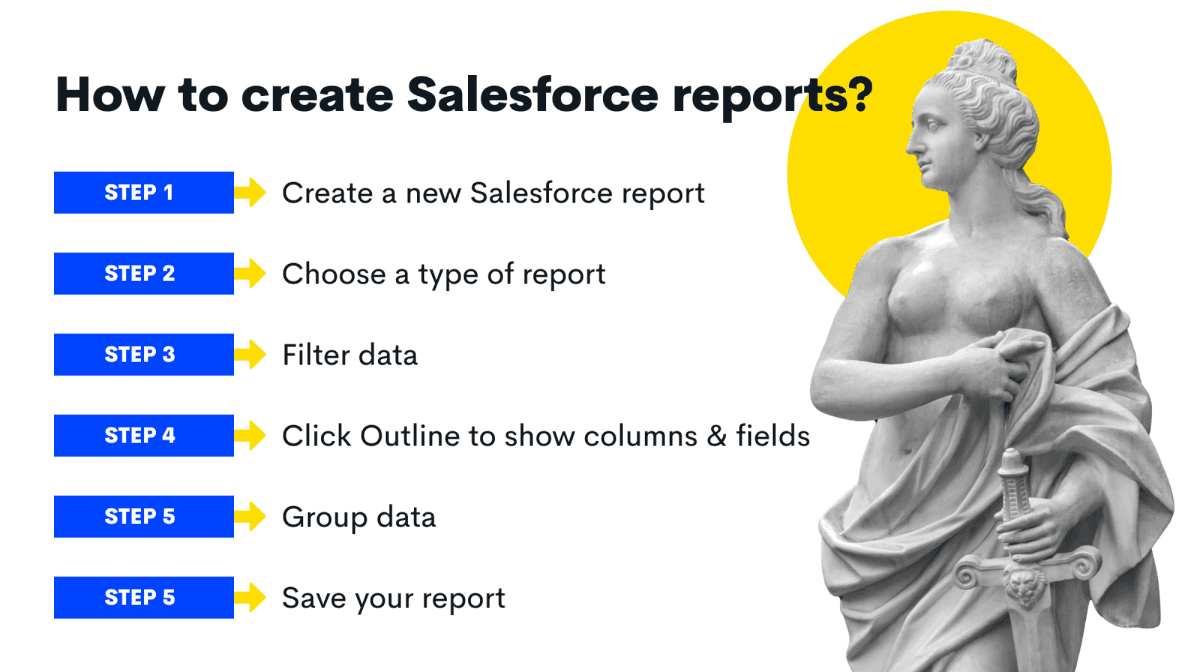
Step 1. Create a new Salesforce report
To locate a Salesforce report, find the "Reports" object in your horizontal navigation bar. If you can't find this tab, check the objects under the "More" tab and click "New Report" to see the window.
Step 2. Choose a type of report
Next, choose the report type in Salesforce and press "Continue". There is a wide range of reports. To make your search easier, you can enter keywords to filter the reports. For instance, if you want a report on your contact history, type "Contact History" to see the applicable results.
Step 3. Filter data
To select the scope for the Salesforce report, access the "Filters" panel. If you filter reports exclusively based on open deals, follow these steps:
- Locate the "Status" field
- Choose the desired statuses from the "Status" filter type
- Click on "Apply".
To add more filters using Salesforce report filter logic, click on field names to choose additional fields for your report.
Step 4. Click Outline to show columns and fields
The "Outline" pane allows adding or removing columns effortlessly with the drag and drop tool. Suppose you require more information in your report, such as an estimated closing date. You can type "Est. Close Date" in the Columns section to filter your results. Once you have found the relevant field, you can either double-click or click and drag it to the report on the right, placing it in the necessary location.
Step 5. Group data
If you choose to group your data by estimated closing date, simply type "Est. Close Date" in the "Groups" section to filter your results. When grouping your deals by this parameter, you can also group data by day, week, month, and more.
Step 6. Save your report
To save your Salesforce reports, follow the steps below:
- Click the "Save & Run" button
- Provide the details by filling in the "Report Name", "Report Unique Name", and "Report Description" fields
- Choose a folder where you want to save your report. Also, select "Public Reports Folder" to make a report available to others and "Private Reports Folder" to make it visible only to you.
- Click on the "Save" button to complete the process
As you can see, creating Salesforce reports gives you many opportunities to view data from different angles. However, there is more to it than just that. You can also subscribe to these reports!
How to subscribe to Salesforce reports?

You can enable the subscription feature to stay updated in the following way:
Step 1. Proceed to the Reports tab
Select "Reports" from the navigation bar.
Step 2. Click Arrow Down and choose “Subscribe”
Click the "Arrow Down" button and select "Subscribe" next to the report you want to subscribe to.
Step 3. Edit your subscription
Here, you can set how often and when you want to evaluate your subscription.
Also, you can add conditions at this stage by specifying a few critical conditions in the parts, such as Aggregate (a basis of the condition), Operator (a basis of comparison), and Value (the number you want the aggregate compared to)
Step 4. Save your subscription
Click "Save" and make sure your subscription is active!
Next, we suggest you learn how to edit and delete reports.
How to edit and delete a Salesforce report
Editing: Сlick the down arrow button and select the "Edit" button if you need to make edits.
Deleting: You can delete a report from the Reports tab and the report's run page.
To delete from Reports, go to the "Reports" in the navigation bar and click the down arrow button next to the report you want to delete. Then, select "Delete".
To remove a report in Salesforce from the report's run page, click the down arrow and choose "Delete".
Also, you may want to know how to export reports to Excel. And we are ready to instruct you again!
How to export Salesforce reports to Excel

Just take the following three steps, and you're done!
Step 1. Choose the report you need to export
Choose "Reports" in the navigation bar and click "Arrow Down" next to the report you need to export. Then, choose "Export".
Step 2. Choose the export view
When exporting a report from Salesforce, you have two options: Formatted Report and Details Only Report.
If you choose Formatted Report, the file type will be .xlsx, and the report will include the report header, groupings, and filter details.
If you choose Details Only Report, each detail row will be exported without formatting, and you can choose to save it in either Excel Format .xls or Comma Delimited .csv.
Step 3. Export a report
Click "Export Button" and get your data exported.
The next and last instruction in our guide is about how to place a report on the dashboard.
How to put a report on your dashboard
To place Salesforce reports on a dashboard, do the following:
Step 1. Edit your dashboard
Go to a dashboards tab and pick a dashboard. Then, click "Edit".
Step 2. Choose Add Plus Component
When you see a list of available reports, select the one you want to add.
Step 3. Select a report type
The report can be in the form of a bar graph, chart, and funnel. Choose the one that suits you best.
You can now personalize your Dashboard Component:
Y-Axis and X-Axis
On every axis, select either a group or a measure to be displayed.
Show Values
Specify whether chart segments will display values.
Display Units
Choose the way to display values.
Show Chatter Photos
Specify whether chatter photos will be displayed.
Decimal Places
Select the number of decimal places that should be on numbers.
Y-Axis Range or X-Axis
Set axis range.
Sort By
Choose the way to sort groups or measures shown in the bar chart.
Max Values Displayed
Select how many groups will be displayed in the bar chart.
Custom Link
A link from a dashboard component to a Salesforce Record (or another site).
Title
Give a title to the chart.
Subtitle
Give a subtitle to the chart.
Footer
Give a footer to the chart.
Component Theme
Choose a Dark or a Light theme.
Note: You can customize the colours of your charts through the dashboard properties menu. For this, go to "Dashboard", click "Edit", click the "Gear Icon" to open the Properties menu, and customize colours.
Step 4. Add a report
Finally, click on "Add". The component will be added automatically, but you can rearrange it by dragging and dropping it.
Wrap up
You now have a good grasp of Salesforce reports and know how to create them. So, it's time to craft your first report and gain deeper insights into your data!
If you have other questions about Salesforce reports or need assistance creating them, the best Salesforce consulting companies are ready to help you!


